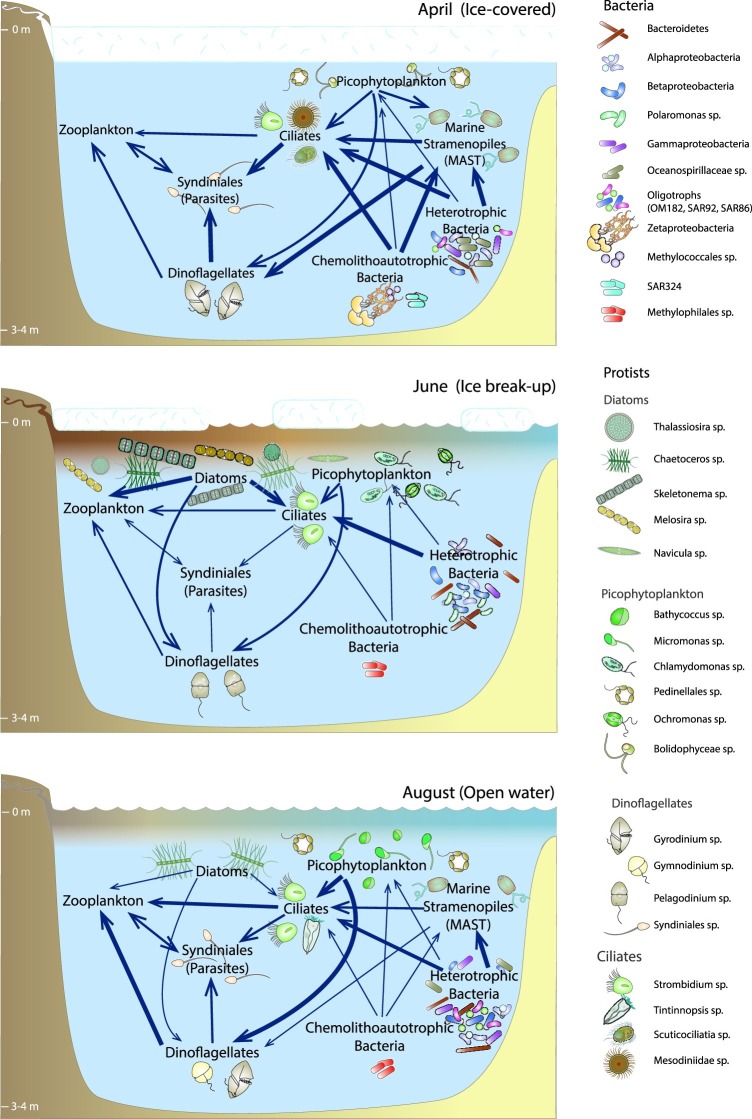
Figure 7.
Diagram depicting major seasonal microbial community changes in the Beaufort Lagoons ecosystem, with arrows depicting hypothesized pathways for carbon flow from one group of organisms to another. The size of the arrow indicates relative magnitude of this hypothesized carbon flow, and the size of the text indicates relative size of the carbon pool, based on the relative abundance of microbial taxa each month. Many symbols after (Caron et al., 2017) or courtesy of the Integration and Application Network (ian.umces.edu/symbols/).

