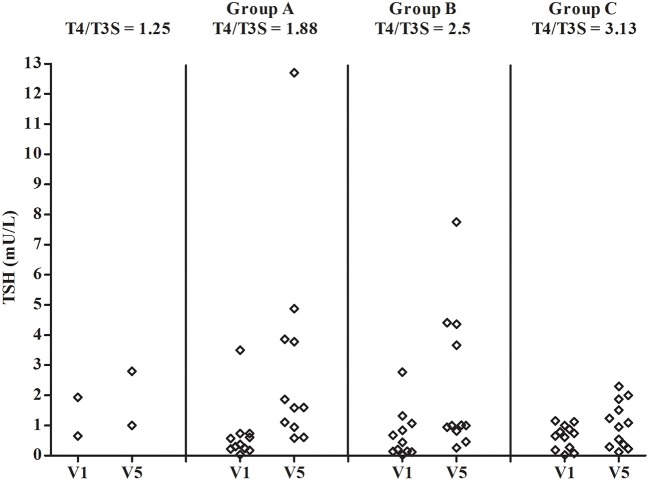
Figure 4.
Individual concentrations of serum TSH in patients on L-T4 treatment (V1) and on L-T4+T3S (V5). The various groups are labeled according to the T4/T3S ratio of their treatment regimen: group A = 1.88, group B = 2.5, group C = 3.13. The 2 patients from group A and group B, who had to increase the T3S dose to 60 and 80 μg, respectively, are indicated as receiving a T4/T3S ratio = 1.25.

