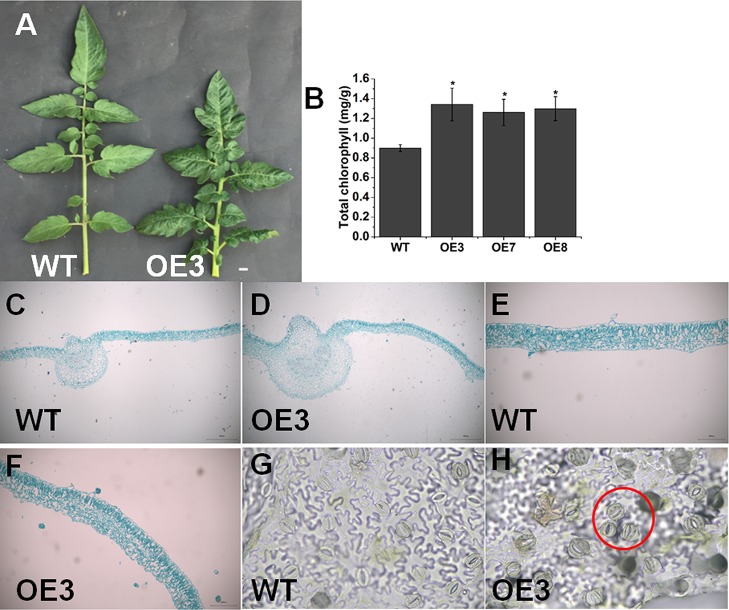
Figure 5.
Overexpression of SlOFP20 alters leaf growth. (A) Comparison of the leaves of WT and OE3 plants. Bar = 1 cm. (B) Total chlorophyll content in mature leaves of WT and transgenic plants. Each value represents the mean ± SE of three biological replicates. Asterisks indicate a significant difference (P < 0.05). (C–F) The leaf structure of WT and OE3 mature leaves. Bar = 100 μm. Stoma morphology of WT (G) and OE3 (H) leaves. Bar = 100 μm.

