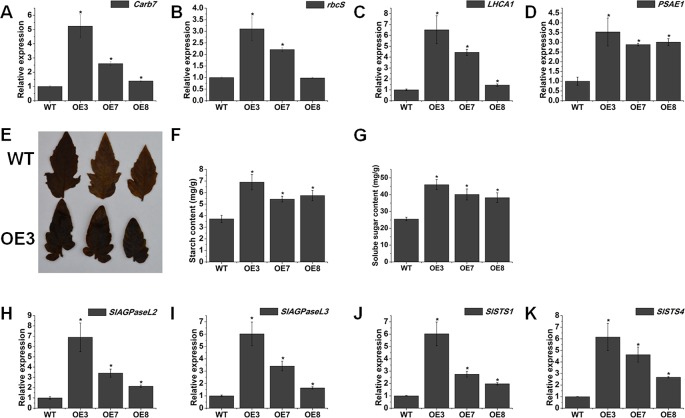
Figure 7.
Ectopic expression of SlOFP20 affects sugar metabolism. (A–D) The transcript levels of photosynthesis-related genes. (E) Starch I2/KI staining results for the WT and OE3 leaves. (F, G) Contents of starch and soluble sugar. (H–K) Expression analysis of genes involved in starch synthesis. Each value represents the mean ± SE of three biological replicates. Asterisks indicate a significant difference (P < 0.05).

