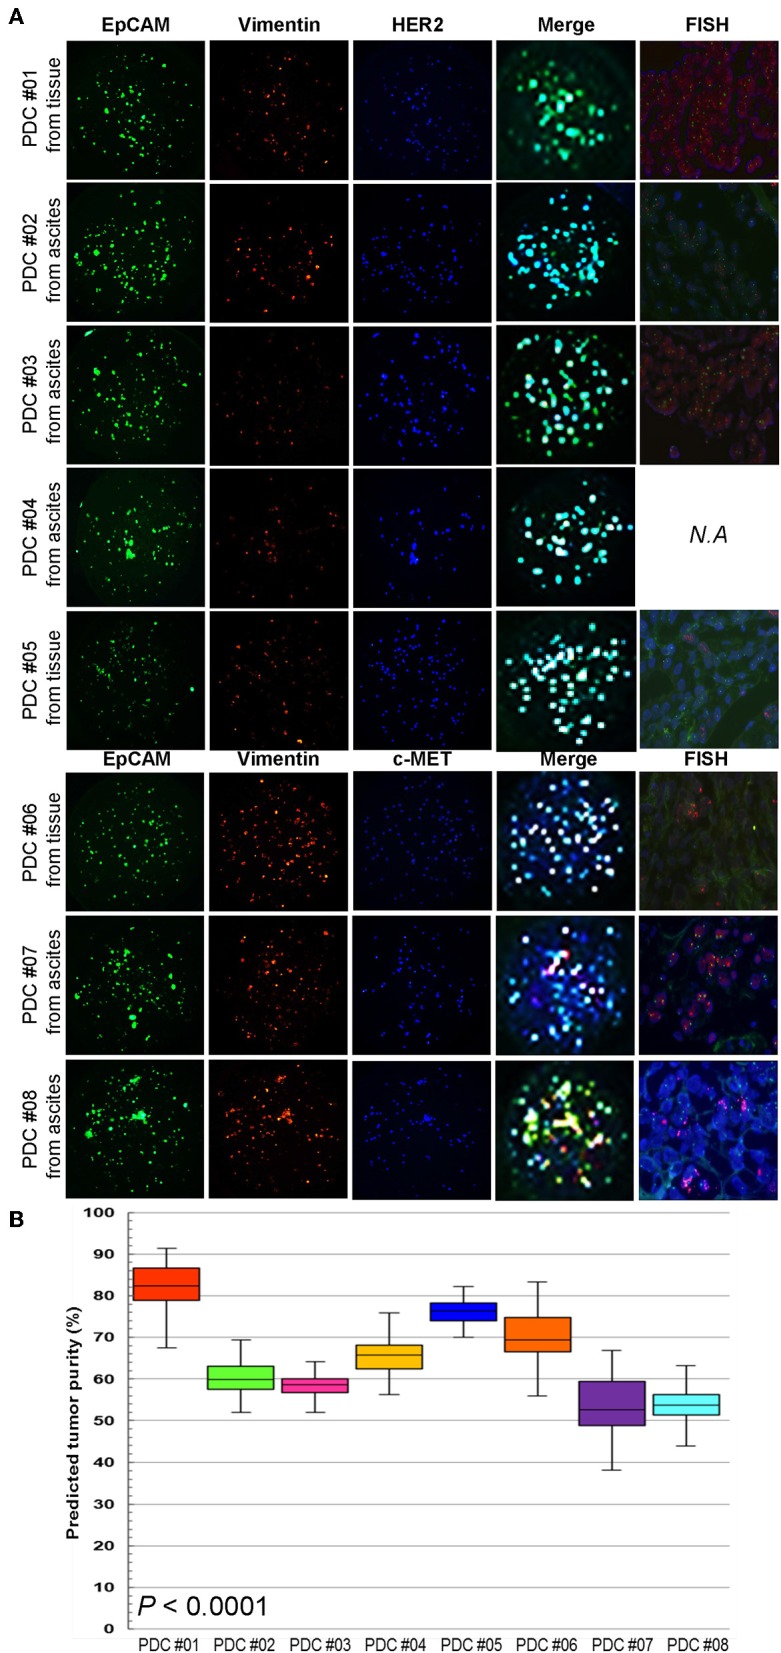
Figure 3.

Multi-channel immunofluorescence images of PDCs from 8 gastric cancer patients (A) EpCAM, vimentin staining, and merge images for predicting tumor purity in PDCs. The green color shows cancer cell staining and red color is the fibroblast signal. Addition of target oncogene staining to detect HER2 and MET expression in PDCs. The blue color shows HER2 expression in PDC #01-05 and MET expression in PDC #06-08. (B) Actual tumor purity and predicted tumor purity.
