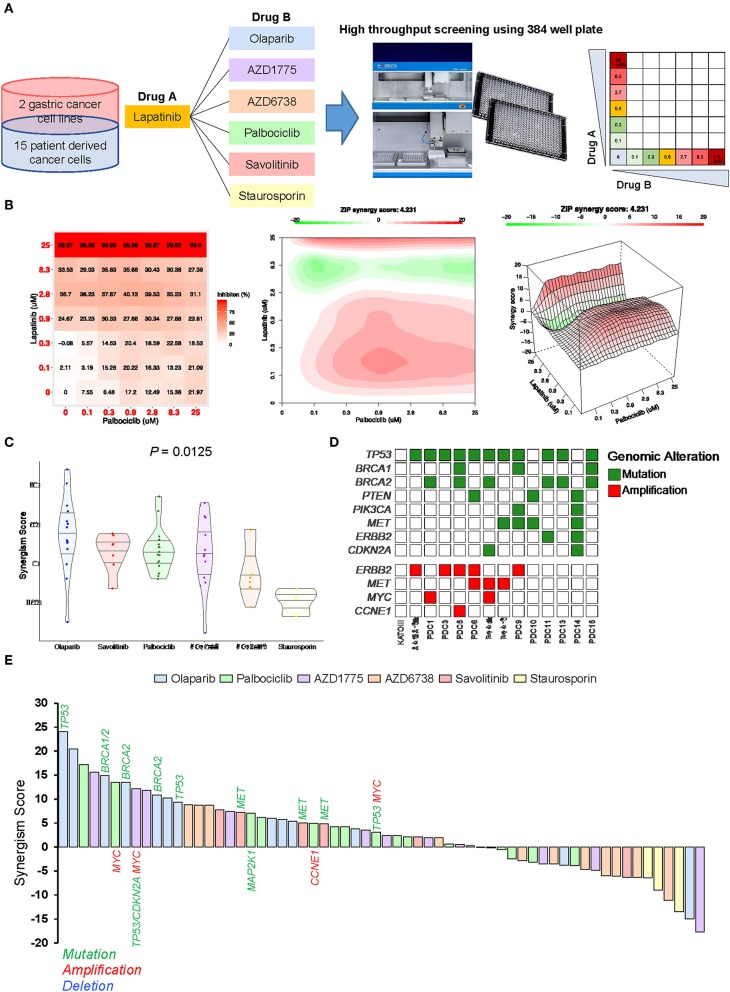
Figure 4.
Systematic evaluation of two-drug combination therapy in gastric PDCs (A) Representative overview of systematic evaluation of two-drug combination therapy for lapatinib with olaparib, AZD1775, AZD6738, palbociclib, savolitinib, or staurosporin. (B) Dose-response matrix for two-drug combination (left panel) and 2D (middle panel) and 3D (right panel) synergy maps. (C) Representative violin plots for synergism scores for respective drug combinations. Horizontal lines within the violin plots represent 0.25, 0.50, and 0.75 quantiles. P value was calculated by analysis of variance test. (D) Genomic landscape of gastric PDCs and gastric cancer cell lines. (E) Waterfall plot representation of two-drug combination synergism scores for each drug combination. Genomic mutation, amplification, and deletion are labeled in green, red, and blue colors, respectively.

