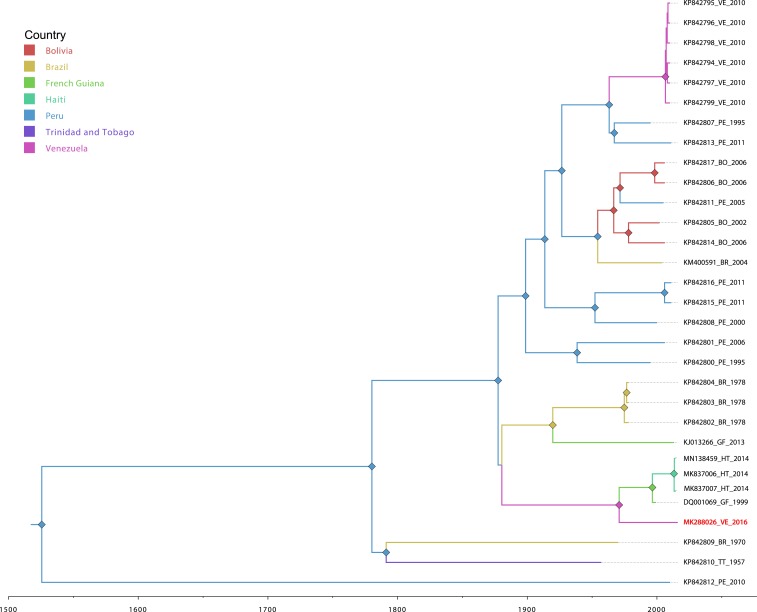
Figure 4.
Bayesian phylogeographic analysis of Mayaro virus genotype D strains. Time-scaled phylogenetic maximum clade credibility tree inferred using the constant demographic prior, strict molecular clock and asymmetric phylogeographic diffusion models, implemented in BEAST v1.8.4. Branches are colored according to geographical location, and diamonds represent branches supported by posterior probability > 0.9 and are colored based on the ancestral state reconstruction for the country of origin. This figure appears in color at www.ajtmh.org.

