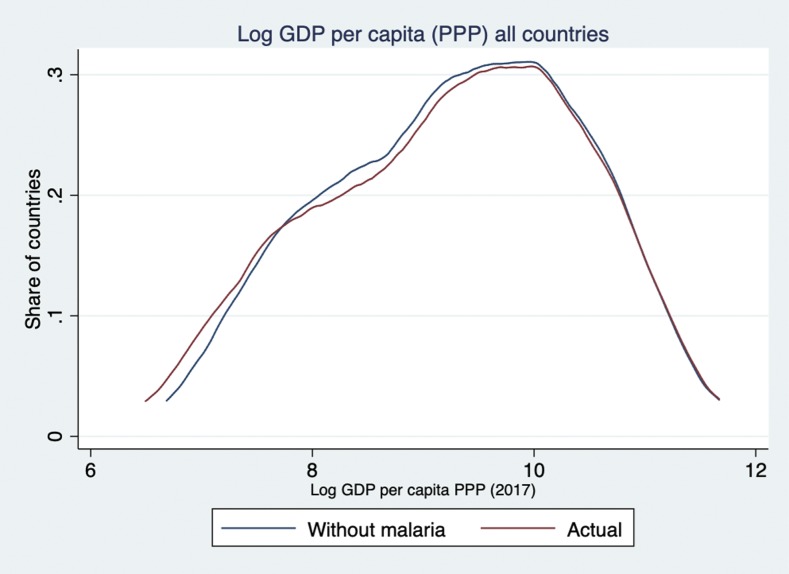
Figure 2.
The world distribution of log gross domestic product per capita (GDPpc) purchasing power parity (PPP): actual (gray) and as predicted with a 100% reduction in malaria incidence (black). Simulation based on column 4 of Table 4. The vertical y-axis displays the proportion of countries. The horizontal x-axis displays log GDPpc PPP in 2017. The gray and black curves are continuous functions used to display the distribution of log GDPpc PPP across countries in 2017. Reading from the left to right: the gray curve shows that at 2017 malaria transmission levels, countries in the lowest 10th percentile of income had a log GDPpc PPP of 7.53 or less, equivalent to GDPpc PPP of 1,863; the black curve shows that without malaria, countries in the lowest 10th percentile of income would have a log GDPpc of 7.66 or less, equivalent to GDPpc PPP of 2,122. This indicates a rightward shift in log GDPpc PPP on the x-axis. Similarly, at 2017 transmission levels, 16.3% of countries had a log GDPpc PPP of 8 or below, equivalent to GDPpc PPP of 2,981 (gray curve). Assuming no malaria transmission in 2017, only 15.3% of countries would have a log GDPpc PPP of 8 or less. The crossing of the black and gray curves on the left side of the graph indicates a shift in the country mass, as low GDPpc PPP countries move to the right because of the economic gains associated with no malaria transmission. Finally, as expected, there is no change in the right side of the distribution as high GDPpc PPP countries have low or no malaria transmission, and thus, a change in transmission will not be associated with any economic gains from malaria elimination, according to our empirical model.

