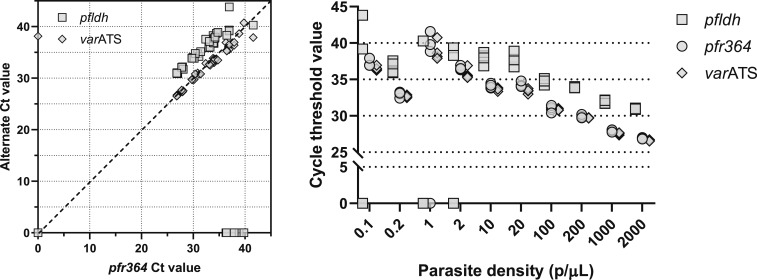
Figure 1.
Comparison of cycle threshold (Ct) values of real-time PCR Plasmodium falciparum detection assays genomic DNA (gDNA) extracted from dried blood spots (DBSs) prepared by spiking into whole blood P. falciparum 3D7 parasites at densities of 0.1 to 2,000 parasites/µL (p/µL) were tested in parallel in real-time PCR assays targeting pfr364, pfldh, and varATS. Each template was tested in quadruplicate in each assay, and Ct lines were manually set for each assay at identical ΔRn values above background fluorescence and in the exponential phase of amplification. A Ct value of 0 indicates failed amplification. Left: scatterplot of Ct values of pfr364 (x axis) and corresponding Ct values of pfldh or varATS (y axis) during amplification of gDNA of mocked DBSs across a range of parasite densities. Dotted line indicates equality. Right: Ct values for pfldh (squares), pfr364 (circles), and varATS (diamonds) as a function of parasite density.

