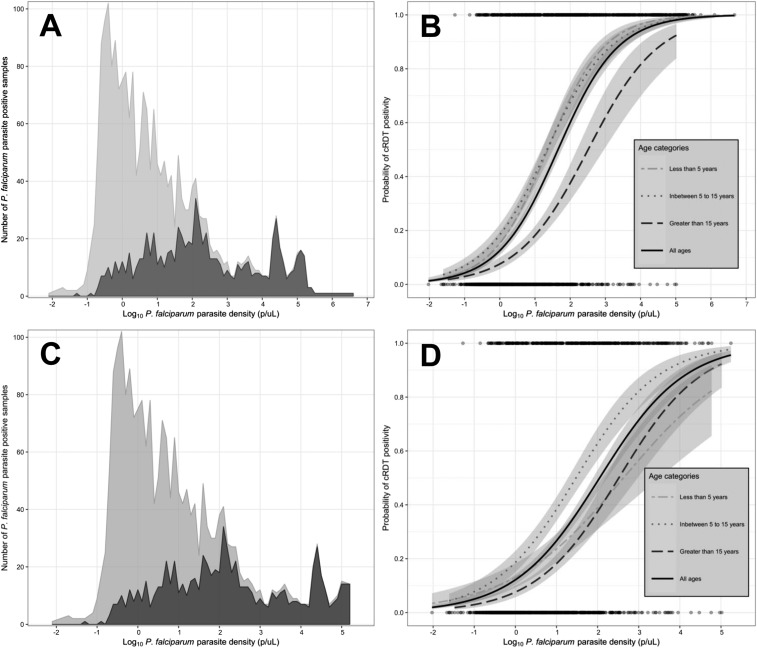
Figure 2.
Parasite density distribution and probability of detection by conventional rapid diagnostic test (cRDT). (A) Distribution of parasite densities estimated by PCR among cRDT-positive (dark gray) and cRDT-negative (light gray) participants for all participants (case, control, and asymptomatic household members). (B) Probability of cRDT positivity as a function of PCR-estimated parasite density for all participants (case, control, and asymptomatic household members), modeled by logistic regression and stratified by age categories. Dots at top and bottom indicate positive and negative cRDT results, and gray shading indicates 95% CI of modeled probability. (C) Distribution of parasite densities estimated by PCR among cRDT-positive (dark gray) and cRDT-negative (light gray) participants for only asymptomatic household members. (D) Probability of cRDT positivity as a function of PCR-estimated parasite density for only asymptomatic household members, modeled by logistic regression and stratified by age categories. Dots at top and bottom indicate positive and negative cRDT results, and gray shading indicates 95% CI of modeled probability.

