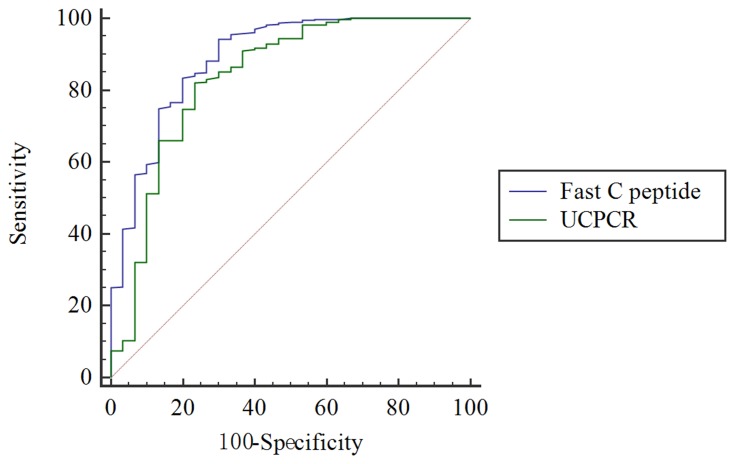
Figure 1.
ROC curve to identify LADA from T2DM. The green curve represents a cutoff UCPCR ≥ 0.46 nmol/mmol for discriminating LADA from T2DM (AUC 0.835) with 82.1% sensitivity and 76.7% specificity. The blue curve represents the performance of fasting C-peptide in distinguishing between LADA and T2DM. The difference in AUC between UCPCR and serum C-peptide was 0.0549, Z statistic was 1.72, and P = 0.08. ROC, receiver operating characteristic; LADA, latent autoimmune diabetes in adults; T2DM, type 2 diabetes mellitus; UCPCR, urine C-peptide creatinine ratio; AUC, area under the curve.

