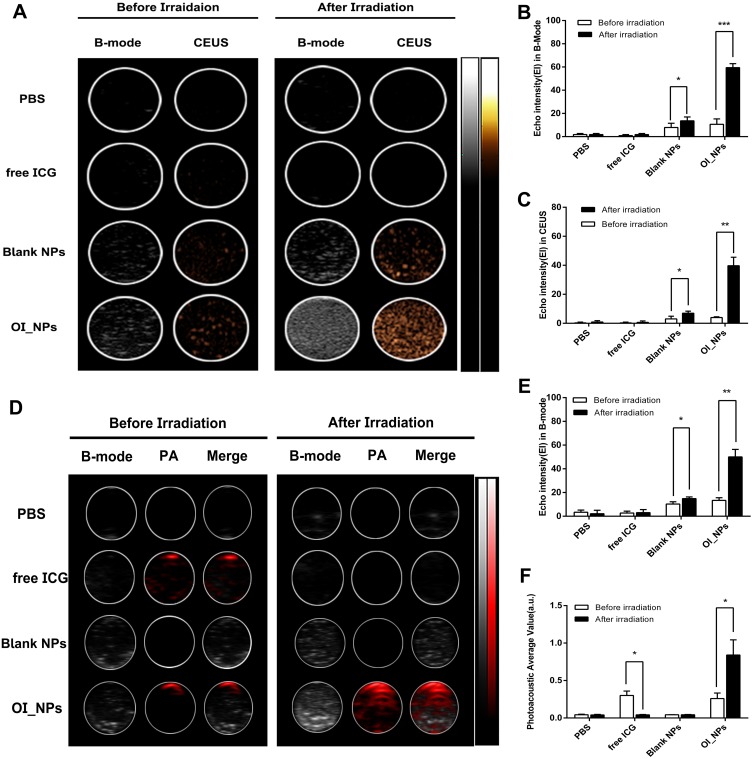
Figure 3.
In vitro ultrasound and photoacoustic imaging of OI_NPs. (A) B-mode and CEUS imaging of different groups before and after irradiation in a phantom gel model. (B) and (C) EI in B-mode and CEUS mode after different treatments. (D) B-Mode and PA -Mode imaging of different groups before and after irradiation. (E) EI in B-Mode and (F) Mean PA. All values represent means ± SD (n=3). The Students’ paired t-test was used to compare data before irradiation and after irradiation. Levels of significance are indicated as *P<0.05; **P<0.01; ***P<0.001.
Abbreviations: NPs, nanoparticles; ICG, indocyanine green; OI_NPs, indocyanine green, perfluoropentane and oxaliplatin loaded nanoparticles; CEUS, contrast-enhanced ultrasound; EI, echo intensity; US, ultrasound; PA, photoacoustic; SD, standard deviation.

