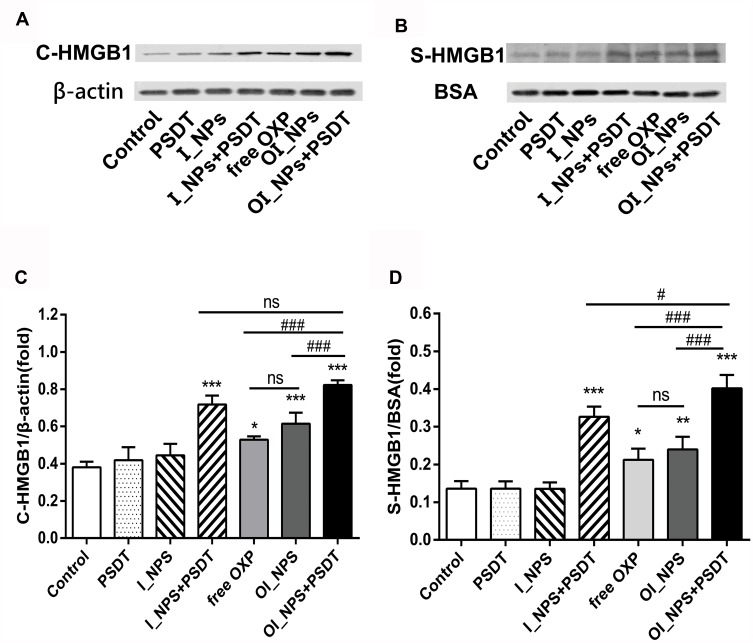
Figure 8.
The release of HMGB1 in response to different treatments. (A) Cytosolic HMGB1 (C-HMGB1) was measured using Western blots; β-actin was used as a control. (B) The release of HMGB1 in the supernatant (S-HMGB1) was measured by Western blotting. BSA was used as the control protein. (C) Quantification of the band intensity of C-HMGB1 expression relative to β-actin. (D) Quantification of the band intensity of S-HMGB1 expression relative to BSA. Data in (C) and (D) are presented as means ± SD (n=3). Data were analyzed by Student’s t-tests and ANOVA. *P<0.05, **P<0.01, ***P<0.001 versus control group. #P<0.05 and ###P<0.001 between groups.
Abbreviations: HMGB1, high mobility group box 1; BSA, bovine serum albumin; ICG, indocyanine green; OXP, oxaliplatin; PFP, perfluoropentane ; I_NPs, ICG and PFP loaded nanoparticles; OI_NPs, ICG, PFP and OXP loaded nanoparticles; PSDT, photo–sonodynamic therapy; SD, standard deviation; ns, no significant difference.

