Figure 3.
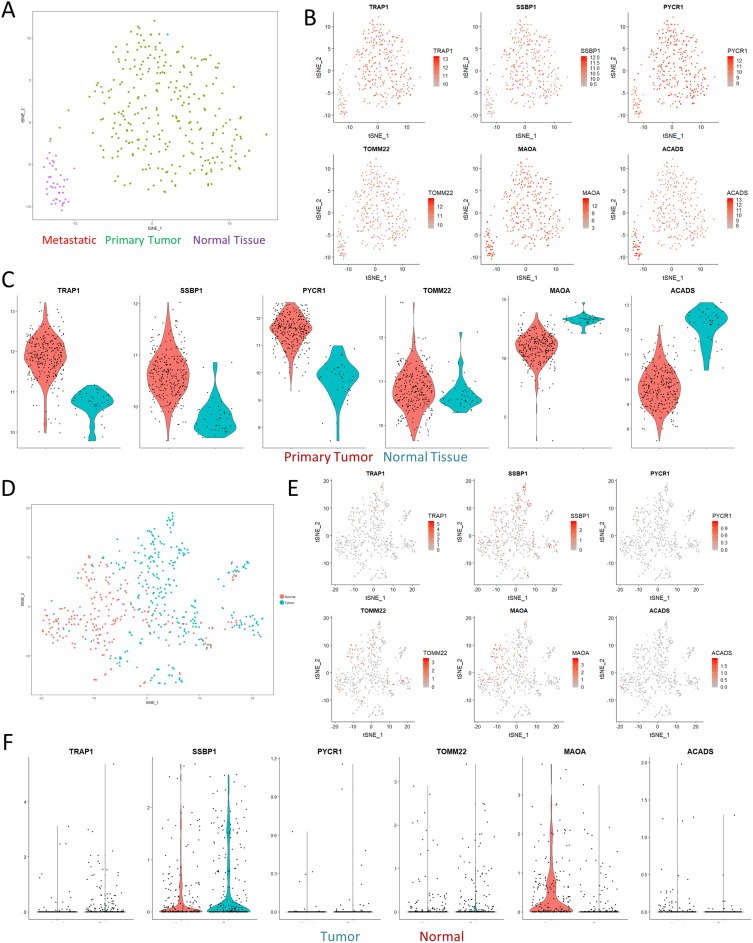
Paired analyses with TCGA and single-cell RNAseq. (A) tSNE visualization of the TCGA colon cancer cohort shows clear separation of normal solid tissue from tumor samples. (B) Overlaid gene expression visualization of the expression profiles of mitochondrial genes identified in Figure 2 shows that the proteomics results we observed could also be matched with larger cohort-level data. (C) Violin plots computing the expression levels between normal and primary tumor samples. All of the visualizations shown were significant at a p-value <0.01 according to Wilcoxian testing. (D) tSNE visualization of a single-cell sequencing dataset of a colorectal cancer sample. (E–F) tSNE visualization and violin plots of the same genes in (B) show similar effects in terms of expression differences, albeit with significant levels of dropout.

