Figure 1.
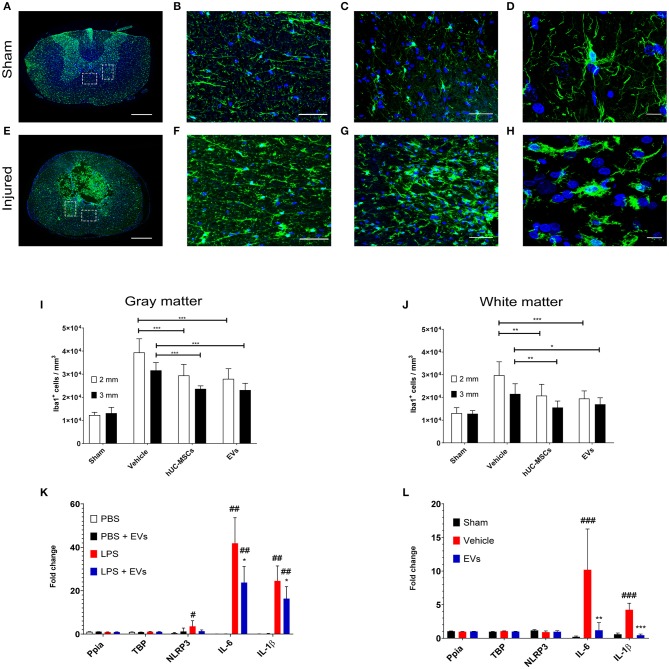
Representative micrographs of the spinal cord of rats from the sham group (A–D) and rats which received a spinal cord injury (2 mm rostral from the epicenter) (E–H). Scale bar in (A,E) = 500 μm. Scale bar in (B,C,F,G) = 50 μm. Scale bar in (D,H) = 10 μm. (A,E) Immunodetection of Iba1-expressing microglia (green). (B,F) larger magnifications of the dashed lined area of the anterior commissure shown in (A,E). (C,G) larger magnifications of the dashed lined area of the ventral horn shown in (A,E). (D) The surveillance microglia shows a small soma size with long filigreed processes. (H) Activated microglia exhibits an amoeboid morphology with a larger soma and few stunted processes. (A–H) Nuclear counterstain was obtained with DAPI (blue). The density of Iba1-expressing cells was quantified 2 weeks after tSCI at 2 mm and 3 mm both rostral and caudal from the lesion epicenter in (I) the ventral horn and in (J) the anterior commissure. The equivalent positions along the rostro–caudal axis were used to measure the density of Iba1-expressing cells in the spinal cord of the sham group. (I,J) Groups were compared using one-way ANOVA and Bonferroni post-hoc test. Statistical significances of column linked by horizontal lines *p ≤ 0.05; **p ≤ 0.01; and ***p ≤ 0.001. (K) Impact of hUC-MSC-EVs on the expression level of pro-inflammatory genes after LPS activation in rat primary microglia. Ppia and TBP were used as non-regulated genes for standardization. Groups were compared using repeated measurement one-way ANOVA and Tukey post-hoc test. Statistical significances compared to the PBS group #p ≤ 0.05; ##p ≤ 0.01; statistical significances compared to the LPS group *p ≤ 0.05. (L) Impact of hUC-MSC-EVs on the expression level of pro-inflammatory genes after tSCI. Ppia and TBP were used as non-regulated genes for standardization. Groups were compared using one-way ANOVA and Bonferroni post-hoc test. Statistical significances compared to the sham group ###p ≤ 0.001; statistical significances compared to the vehicle group **p ≤ 0.01; ***p ≤ 0.001.

