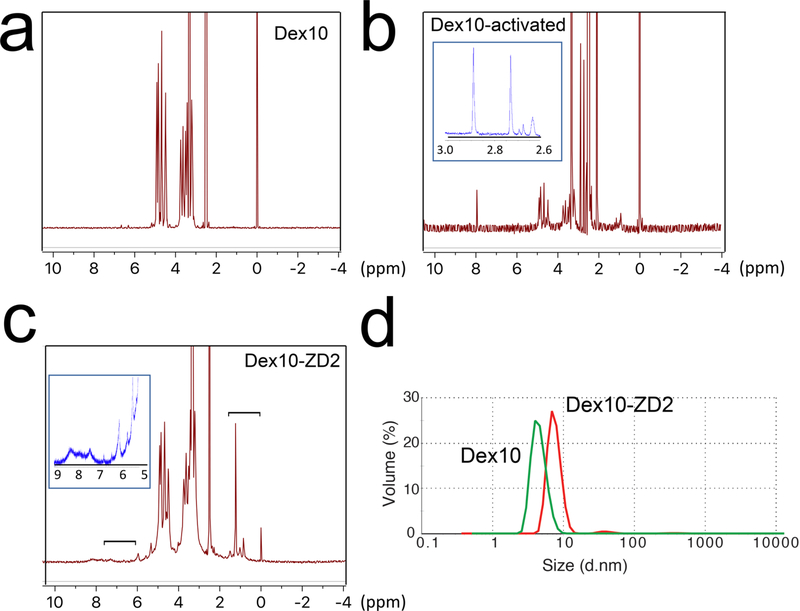
Figure 2.
Characterization of Dex10-ZD2 synthesis. 1H NMR of (a) Dex10, (b) activated Dex10, and (c) Dex10-ZD2. The inset in (b) provides the zoomed view in the range of 2.6–3.0 ppm, with arrows indicating the peaks attributed to succinimidyl groups (2.7 and 2.9 ppm). The brackets in (c) indicate the peptide peaks (i.e, 6–8.5 and 1–1.8 ppm), and the inset is the zoomed view in the range of 5–9 ppm. (d) Dynamic light scattering (DLS) measurement of Dex10 and Dex10-ZD2.

