Figure 3.
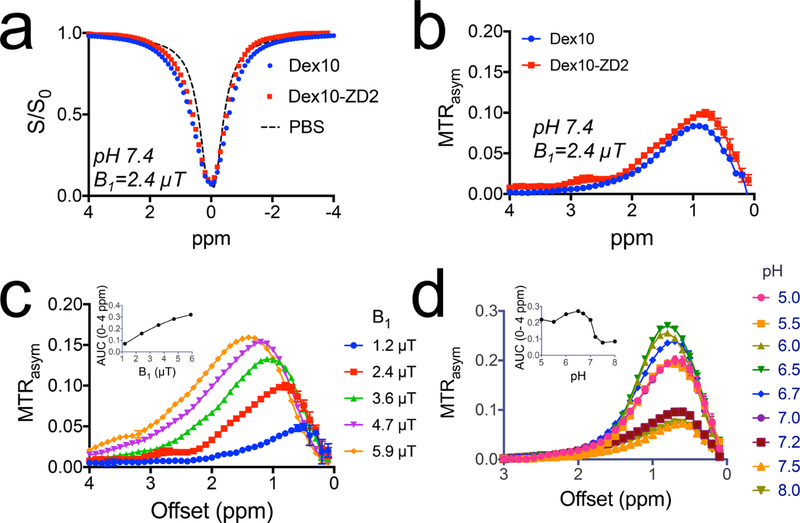
In vitro CEST characteristics of Dex10-ZD2. (a). Z-spectra of Dex10, Dex10-ZD2, and PBS (pH 7.4) using B1 = 2.4 μT. (b) Corresponding MTRasym of Dex10 and Dex10-ZD2 (pH 7.4) using B1 = 2.4 μT. (c) B1 dependence of the CEST signal of Dex10-ZD2. The inset shows the B1 dependence of the integrated area (AUC) from 0 to 4 ppm. (d) pH dependence of the CEST signal of Dex10-ZD2. The inset shows the pH dependence of the integrated area (AUC) from 0 to 4 ppm. All the measurements were performed on 5 mg/mL Dex10 or Dex10-ZD2 solutions (∼500 μM) in PBS at 37 °C.

