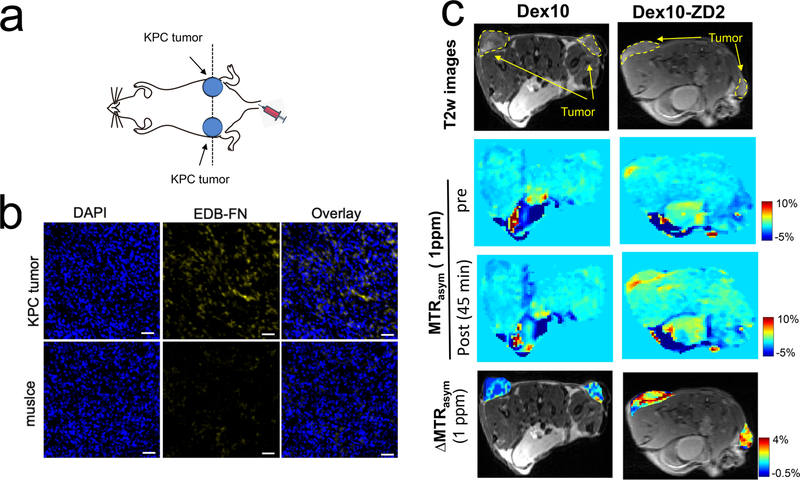
Figure 4.
CEST MRI detection of EDB-FN in KPC pancreatic tumors using Dex10-ZD2. (a) Schematic of the tumor position. (b) Immunohistofluorescence stains of EDB-FN in the tumors and muscle. Blue: nucleus, yellow: EDB-FN, scale bar: 50 μm. (c) Comparison of the CEST MRI images of two representative mice injected with Dex10 (left) and Dex10-ZD2, respectively. From the top to bottom: the T2-weighted (T2w) images showing the ROIs of tumors; CEST images before and post the injection, as quantified by the MTRasym maps at 1 ppm; and the overlaid contrast enhancement of the tumor regions, as quantified by the ΔMTRasym (1 ppm) maps at 45 min postinjection.

