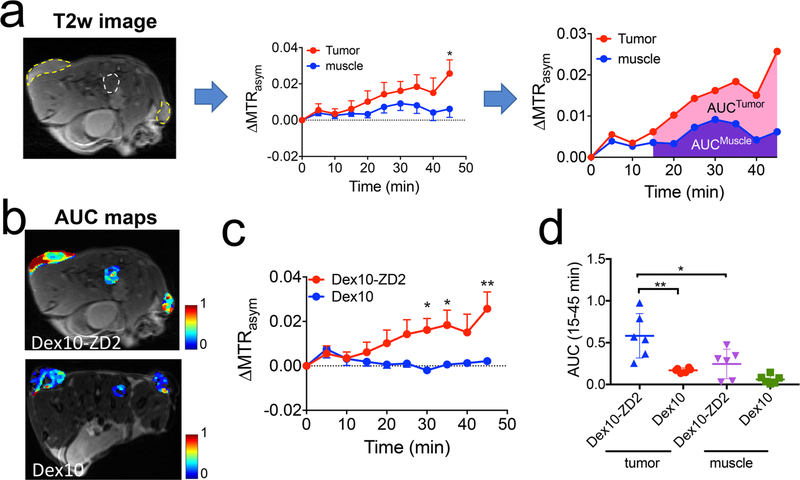
Figure 6.
Dynamic CEST contrast studies. (a) Illustration of the dynamic CEST contrast changes in the tumor and muscle ROIs depicted in the T2-weighted images (left) and semiquantitative analysis using the area-under-curve (AUC) maps calculated by the CEST contrast enhancement in each pixel between 15 and 45 min postinjection. (b) AUC maps of two representative mice injected with Dex10-ZD2 and Dex10, respectively. (c) Average dynamic CEST contrast changes in the tumors injected with Dex10-ZD2 (n = 6) and Dex10 (n = 6), respectively. (d) Scatter plots of AUC values in the tumors (n = 6) and muscle (n = 3). All data are shown as mean ± s.e.m. Student’s t test (n = 6, two-tailed, unpaired) was performed. *: p < 0.05, **: p < 0.01.

