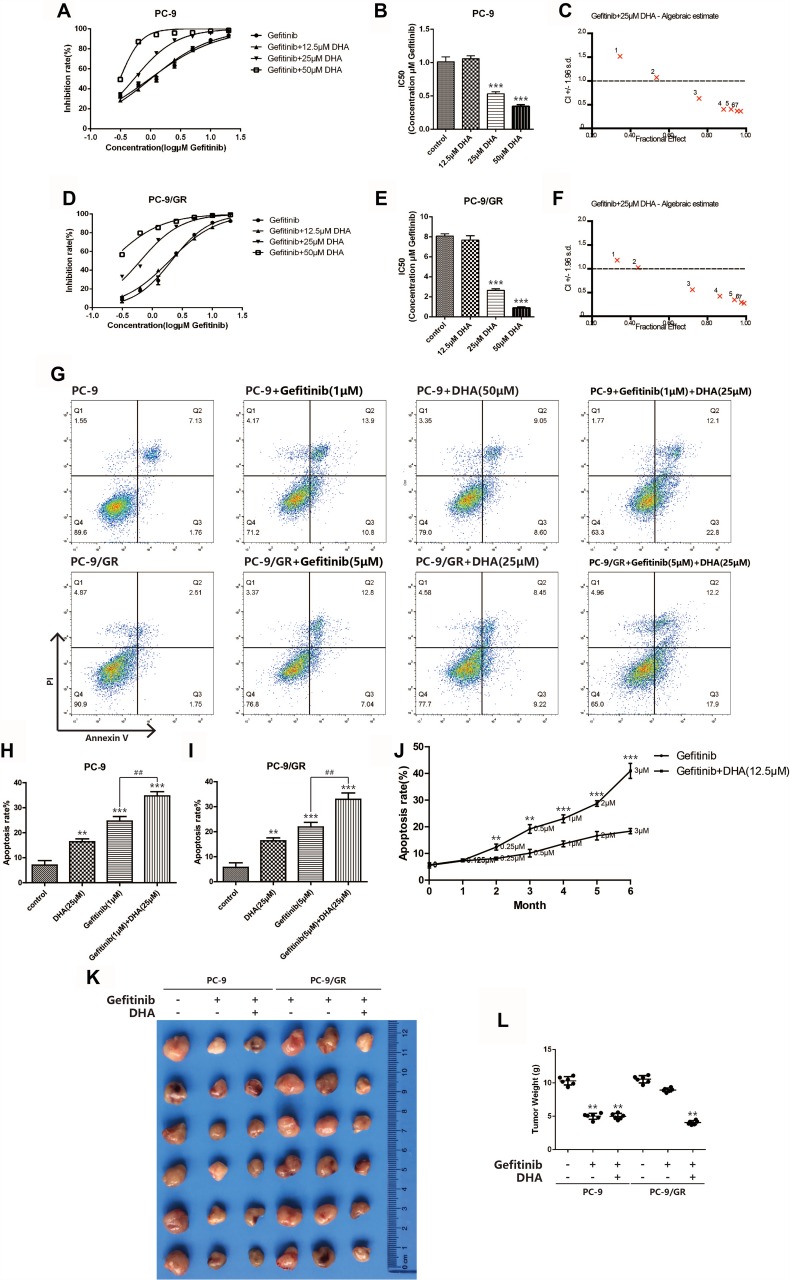
Figure 2.
DHA sensitizes gefitinib-resistant cell line PC-9/GR to gefitinib. (A–B) Inhibition rate of PC-9 cells was assessed after 24hrs of stimulation of combination of gefitinib and DHA (12.5μM, 25μM, 50μM) by CCK8 assay. Bars represent SEM, ***p<0.001 versus non-treated control of PC-9 cells. (C) Combination index was calculated by Calcusyn 2.0 based on the inhibition rate acquired in CCK8 assay. (D–E) Inhibition rate of PC-9/GR cells was assessed after 24hrs of stimulation of combination of gefitinib and DHA (12.5μM, 25μM, 50μM) by CCK8 assay. Bars represent SEM, ***p<0.001 versus non-treated control of PC-9/GR cells. (F) Combination index was calculated by Calcusyn 2.0 based on the inhibition rate acquired in CCK8 assay. (G–I) PC-9 cells and PC-9/GR cells were stained with Annexin V and PI and apoptosis cells were quantitated by flow cytometer after DHA (25μM) and gefitinib (1μM, 5μM) treatment. Results from the experiments are shown as means ± SEM. The data are presented as the percentage of cell inhibition rate to unstimulated cells (0μM). Bars represent SEM, **p<0.01 or ***p<0.001 versus non-treated control of PC-9 and PC-9/GR cells. ## p<0.01 versus non-DHA-treated of PC-9 and PC-9/GR cells. (J) Apoptosis rate of PC-9 cells was assessed after long-term gefitinib stimulation. The dosage of gefitinib was increased once a month for 6 months. DHA (12.5μM) was added to another PC-9 group simultaneously. PC-9 cells were stained with Annexin V and PI and apoptosis cells were quantitated by flow cytometer. Bars represent SEM, **p<0.01 or ***p<0.001 versus non-DHA-treated of PC-9 cells. (K–L) PC-9 and PC-9/GR tumors were transplanted into BALB/C nude mice. Bars represent SEM, **p<0.01 versus non-treated control of PC-9 and PC-9/GR cells.

