
Figure 3.
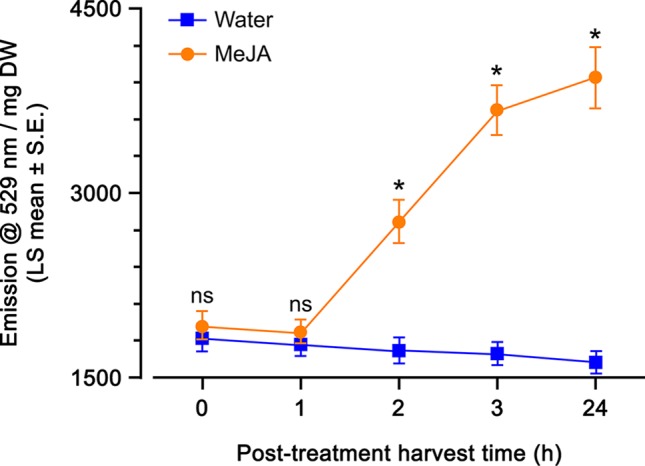
Yellow fluorescent protein (YFP) fluorescence emission (emission at 529 nm per mg dry weight; least squares mean ± standard error) of Arabidopsis thaliana OPR3promoter:YFP-PTS1 plants over time after methyl jasmonate (MeJA) spray compared with water spray. Statistical differences (p-value ≤ 0.05), based on a general linear mixed model, between water and MeJA spray at each time are shown by asterisks; ns, non-significant. N = 10 plants at t = 0 h, N = 12 plants at t = 1 h, N = 8 plants at t = 2 h, N = 10 plants at t = 3 h, N = 9 plants at t = 24 h per treatment. See Table 1 for statistical details.