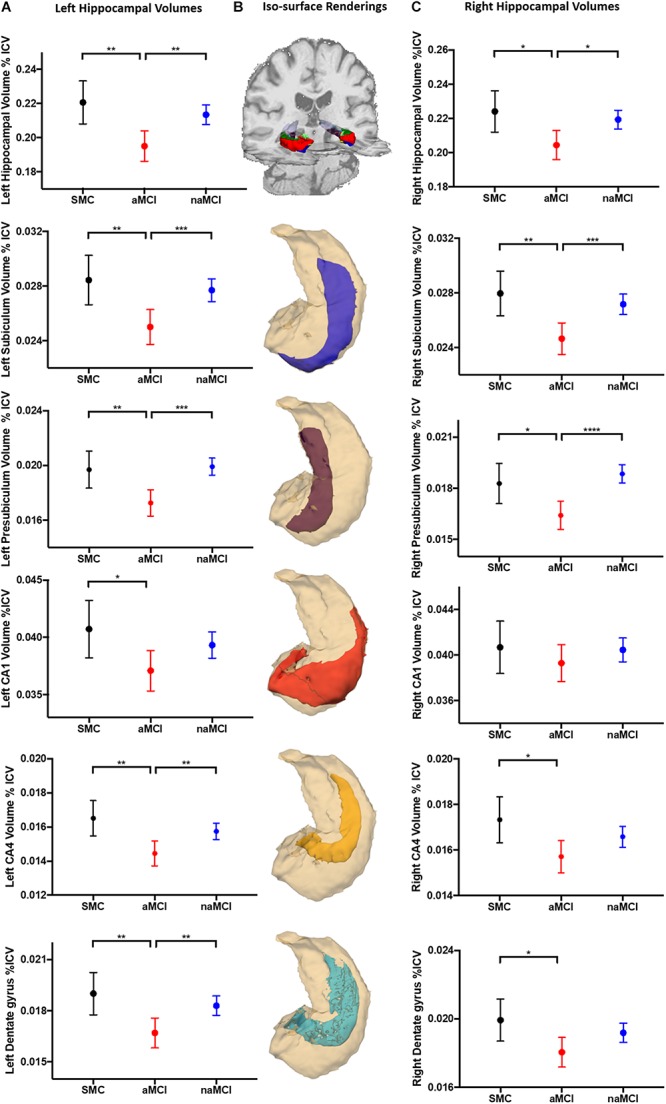
FIGURE 2.

Hippocampal volumetric analysis. Marginal mean (SD) plots of left (A) and right (C) whole hippocampal, and the memory associated subfields subiculum, presubiculum, CA1, CA4 and dentate gyrus volumes from SMC, aMCI and naMCI patient groups. Significant differences between patient groups from One-Way ANCOVA analysis are displayed (∗) revealing that left hippocampal subfields are significantly atrophied in aMCI patients compared to SMC and naMCI groups. This pattern remains but is not as prevalent in the right hippocampus. Iso-surface renderings of an example whole hippocampal segmentation superimposed on coronal and axial planes of a structural 3D T1-weighted dataset (B) are displayed for reference purposes. Subsequent individual subfields of interest (blue = subiculum, magenta = presubiculum, red = CA1, yellow = CA4, cyan = dentate gyrus) shown in relation to the whole hippocampus (cream) are displayed below. Tests of between subject effects revealed that of the covariates, GDS-15 scores were significantly associated with left CA4 and dentate gyrus volume.
