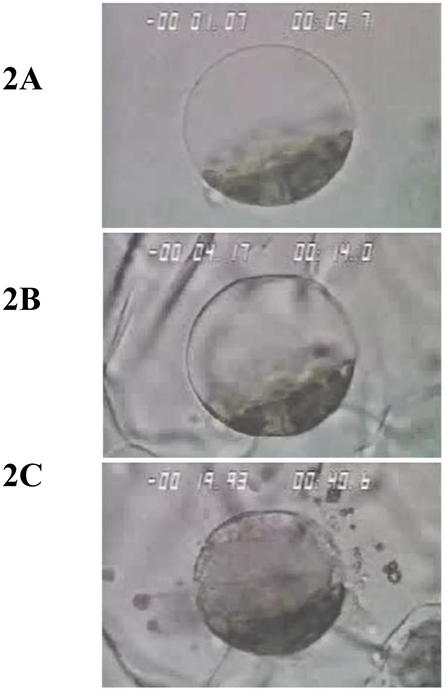
Figure 2.
Illustrates the freeze progression of single cell. In each figure temperature in degrees Celsius appears in the upper left and time in seconds appears in the upper right. In Fig. 2A cooling has proceeded to −1 °C without ice formation. In Fig. 2B extracellular has surrounded the cell without damage. Fig 2C illustrates the consequences of intracellular ice formation with extensive membrane rupture and expulsion of cellular content.

