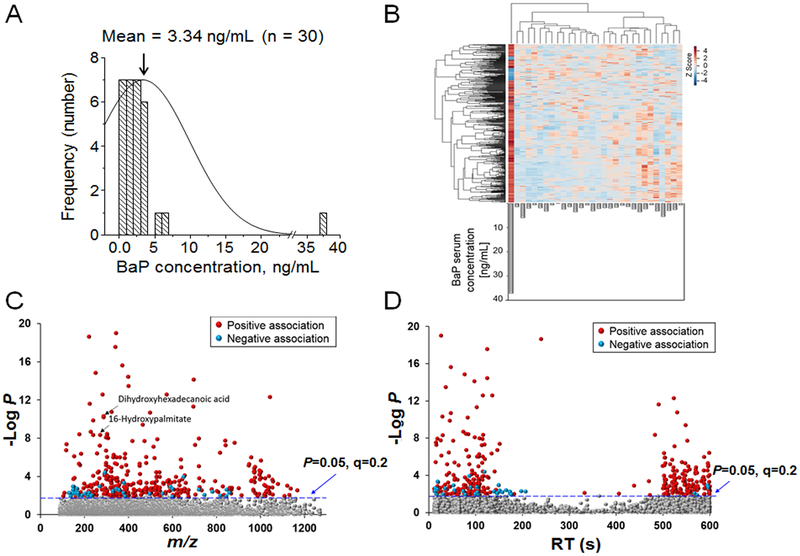
Figure 4. Stratification and identification of features correlating with BaP concentration.
A. The mean concentration of BaP was 3.34 ng/mL for the serum samples (n=30). Concentration is plotted against frequency among the samples with one sample have a concentration of 37.3 ng/mL. B. Unsupervised 2-way way hierarchal clustering heat-map. 400 features were found to be correlated with BaP concentration (shown in gray bars as ng/mL). Of these 400 features, 44 were negatively associated with BaP, while 356 features were positively associated with BaP. C. Type I Manhattan plot of m/z features plotted against the −log P. Shown in gray are the 5723 non-significant features identified after filtering and normalization. 400 features were found to associate with BaP concentration at FDR < 0.2, indicated by the blue dotted line. Features that were positively associated with BaP concentrations (356/400) are shown in red. These included accurate mass matches to dihydroxyhexadecanoic acid (m/z 287.2248, 29 s) and 16-hydroxy-palmitate (m/z 271.2297, 116 s). A relatively small number of features (44/400) was negatively associated with BaP concentration (blue circles). D. Type II Manhattan plot (−log P as a function of retention time on the C18 column) showed that features associated with BaP included both polar species eluting early and relatively non-polar species eluting later.

