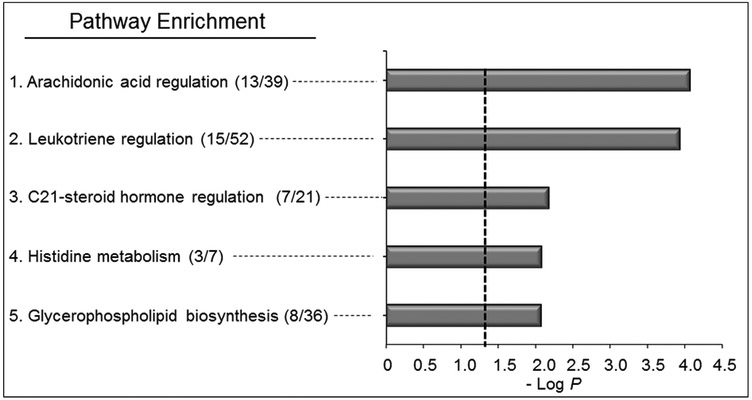
Figure 5. Pathway enrichment analysis of A549 cells after exposure to BaP.
Pathway analysis of BaP exposed features from human serum with different levels of BaP. A total of (5/119) enriched pathways were determined (Filled gray bars indicate significance less than P < 0.05, and the cutoff is indicated by the dotted line). These pathways include arachidonic acid regulation (13/39), leukotriene regulation (15/52), C21-steroid hormone regulation (7/21), histidine metabolism (3/7), and glycerophospholipid biosynthesis (8/36). Numbers in the parentheses indicate the overlap of the metabolites as matched through KEGG and the Edinburgh human metabolic network databases matching using m/z and RT.

