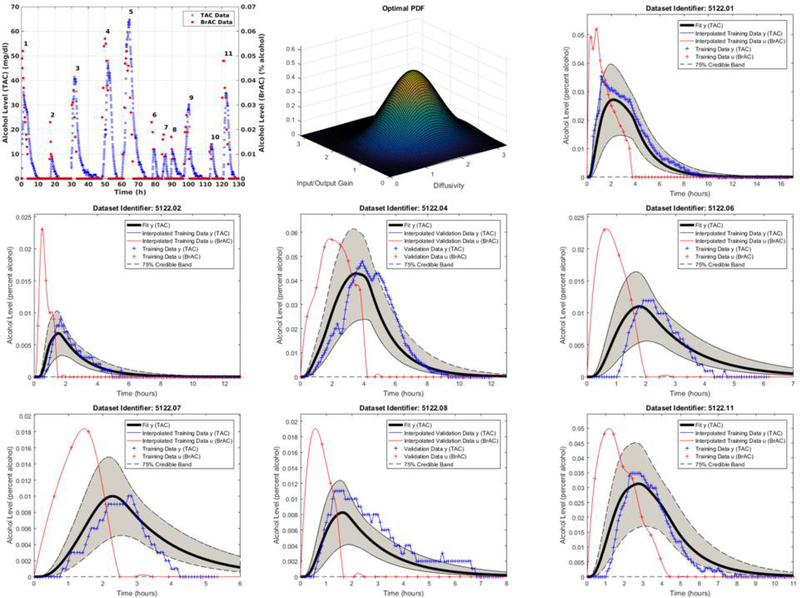
Figure 2.1.
Row-wise from the top left: Panel (a) BrAC and TAC data for the 11 drinking episodes, Panel (b) the optimal pdf, Panels (c), (d), (f), (g), and (i) are the plots of training BrAC and corresponding TAC, resulting fit population model estimated TAC, and 75% credible band; Panels (e) and (h) are the cross validation results.

