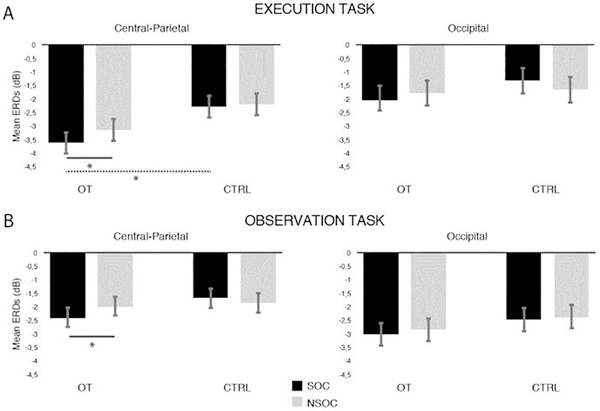
Figure 3: Alpha ERD differences over central-parietal and occipital regions.
Mean and Standard errors (SE) of alpha ERD over central-parietal and occipital scalp regions, by tasks (EXE, OBS), conditions (SOC, NSOC) and experimental group (OT, CTRL). Black bars represent the social condition (SOC), grey bars represent the non-social condition (NSOC). *: significant effects; Solid lines indicate significant effects within groups, the dashed line indicates the significant effect between groups.

