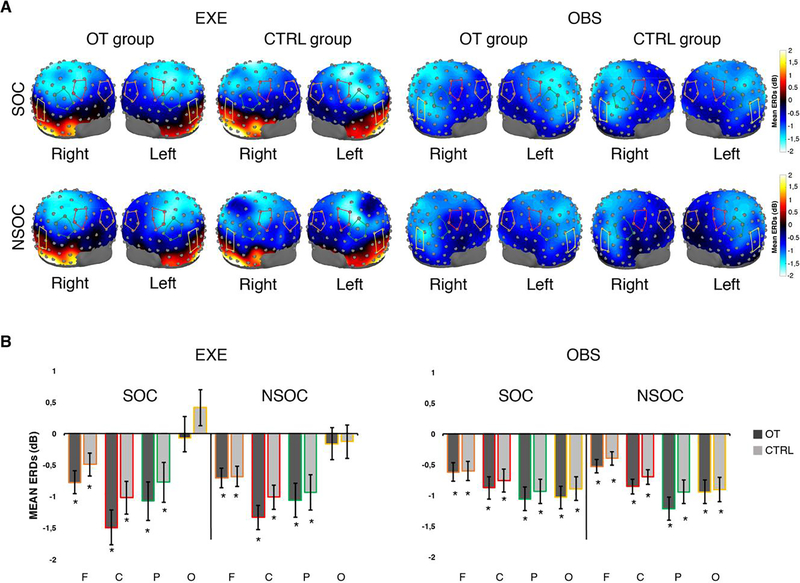
Figure 4: Topographic scalp maps and ERDs for the Beta band.
A. Three-dimensional topomaps overlaid on adult head model (University of South Carolina McCausland Brain Imaging Center Neurodevelopmental MRI Database) showing peaks of EEG desynchronization across the scalp, in the 15 to 25 Hz band, for each group (OT, CTRL), task (EXE, OBS) and condition (SOC, NSOC). The red lines overlaid on the head model indicate the cluster of central electrodes, the green lines indicate the cluster of parietal electrodes, the orange lines indicate the cluster of frontal electrodes, the yellow lines indicate the cluster of occipital electrodes. B. Mean and Standard errors (SE) of alpha ERD across clusters of electrodes (F, C, P, O), conditions and tasks. OT: oxytocin group; CTRL: control group, F: frontal electrodes, C: central electrodes, P: parietal electrodes, O: occipital electrodes; SOC: social condition; NSOC: non-social condition; EXE: execution task; OBS: observation task. * indicates significant desynchronization compared to Baseline.

