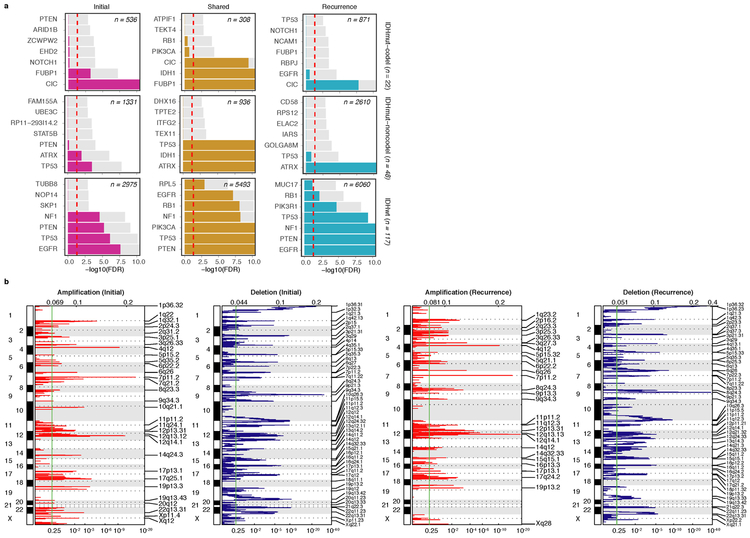
Extended Data Fig. 11 ∣. Aneuploidy calculation.
a. Heatmap displaying the chromosomal arm-level events (x-axis) with patients represented in each row. Patients are placed in the same order for both the initial (left) and recurrence (right). White space was inserted as a break between the three subtypes. b. Distribution of total aneuploidy difference. Acquired aneuploidy determination (upper-quartile) indicated with a red line. c. Comparison of aneuploidy score between initial and recurrent tumors separated by subtype d. As (c), comparing aneuploidy value.

