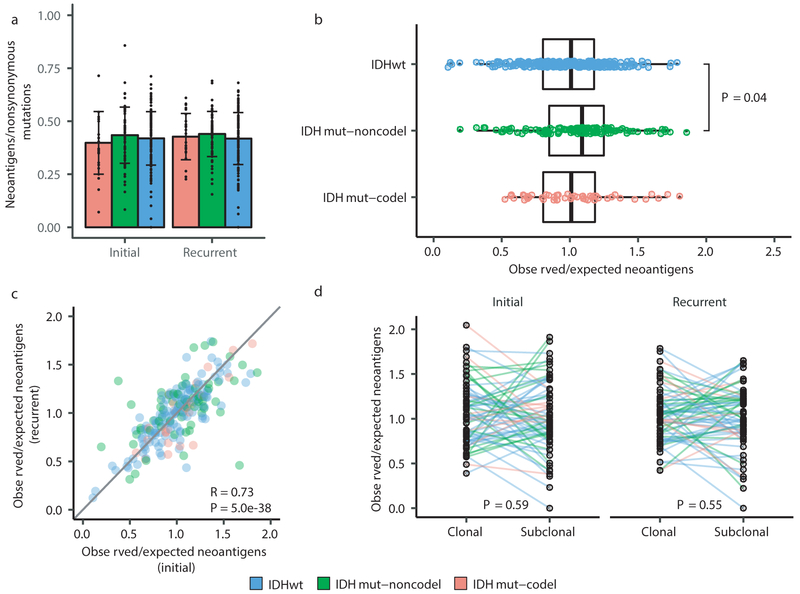
Fig. 4 ∣. Neoantigen selection during tumor progression.
a. Mean proportion of coding mutations giving rise to neoantigens (neoantigens/nonsynonymous) stratified by glioma subtype and timepoint (n = 222). Error bars represent standard deviation. b. Boxplot depicting the distribution of observed to expected neoantigen ratios in the GLASS cohort stratified by glioma subtype. P-value was calculated using the Wilcoxon rank-sum test. Each box spans quartiles, with the lines representing the median ratio for each group. Whiskers represent absolute range, excluding outliers. c. Scatterplot depicting the association between the observed-to-expected neoantigen ratio in a patient’s initial versus recurrent tumor. Each point represents a single patient. R represents Pearson correlation coefficient. Panels b and c only include samples with at least 3 neoantigens in the initial and recurrent tumors (n = 131, 63, and 24 for IDHwt, IDHmut-noncodel, and IDHmut-codel, respectively). d. Ladder plot depicting the difference in observed-to-expected neoantigen ratio between a tumor’s clonal and subclonal neoantigens. Each set of points connected by a line represents one tumor. Tumors are stratified by whether they were a patient’s initial or recurrent tumor. Lines are colored by each patient’s glioma subtype. Panel d only includes samples with at least 3 clonal neoantigens and at least 3 subclonal neoantigens in both the initial and recurrent tumors (n = 35, 20 and 9 for IDHwt, IDHmut-noncodel, and IDHmut-codel, respectively). P-value was calculated using a paired two-sided t-test. Colors in each panel represent the glioma subtype and are denoted at the bottom of the figure.

