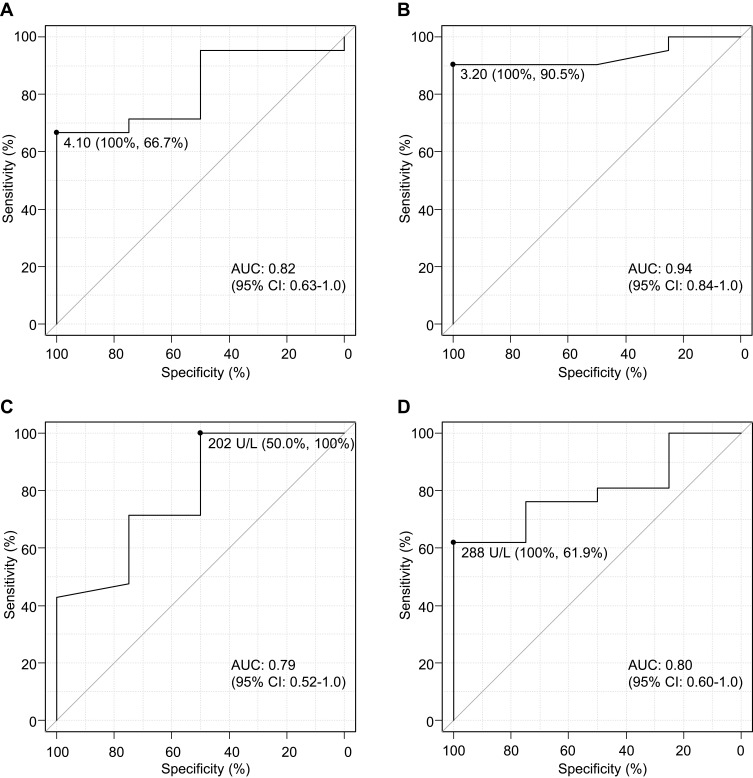
Figure 2.
Receiver operating characteristic (ROC) curve analyses by neutrophil-to-lymphocyte ratio (NLR) and lactate dehydrogenase (LDH). (A) Pre- and (B) post-treatment NLR, (C) pre- and (D) post-treatment LDH. The analyses were performed to determine the most appropriate NLR and LDH cut-off values to identify patients with pseudo-progression. The sensitivity and specificity values were computed to determine the cut-off points that would maximize the sum of the number of true positive and true negative predictions.

