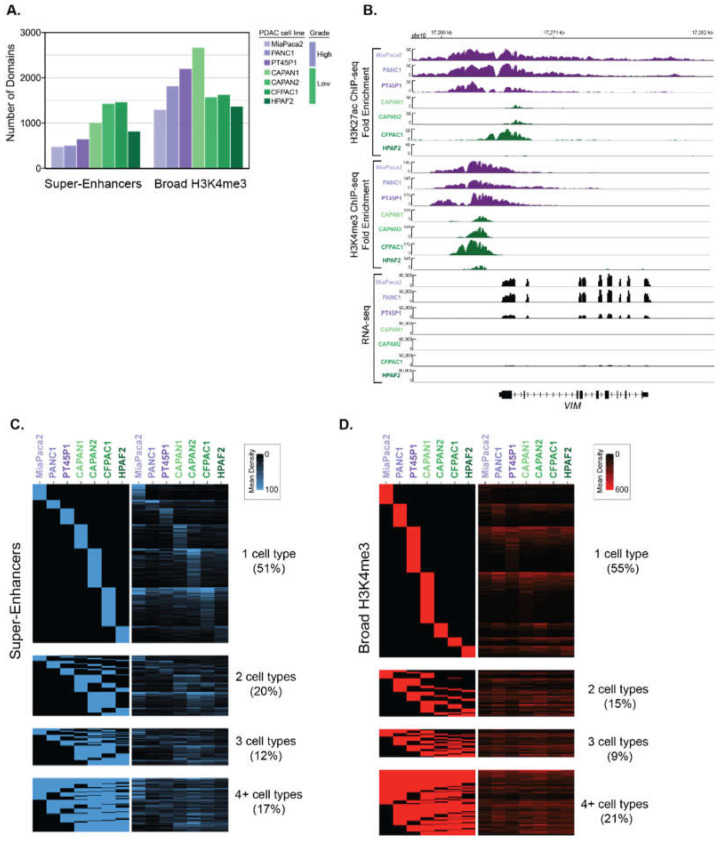
Figure 1.
Determination of super-enhancers and broad H3K4me3 domains in PDAC cell lines that correspond to different histological grades. (A) The total number of super-enhancers and broad H3K4me3 domains found in different human PDAC cell lines that represent either High-Grade (purple) or Low-Grade (green) PDAC groups. (B) Genome browser representation of the H3K27ac and H3K4me3 ChIP-seq signal, as well as the RNA-seq signal over an approximate 14 kb region surrounding the VIM locus. (C,D) Heatmaps displaying the classification of super-enhancer (C) and Broad H3K4me3 (D) domains across seven human PDAC cell lines. The rows represent individual regions and the columns represent the different cell lines. The left panel heatmap is a binary heatmap displaying a region overlap between the cell lines, and the right panel is a signal heatmap of H3K27ac or H3K4me3 signal for (C) and (D) respectively. The color scale represents the signal density of either H3K27ac or H3K4me3, respectively.

