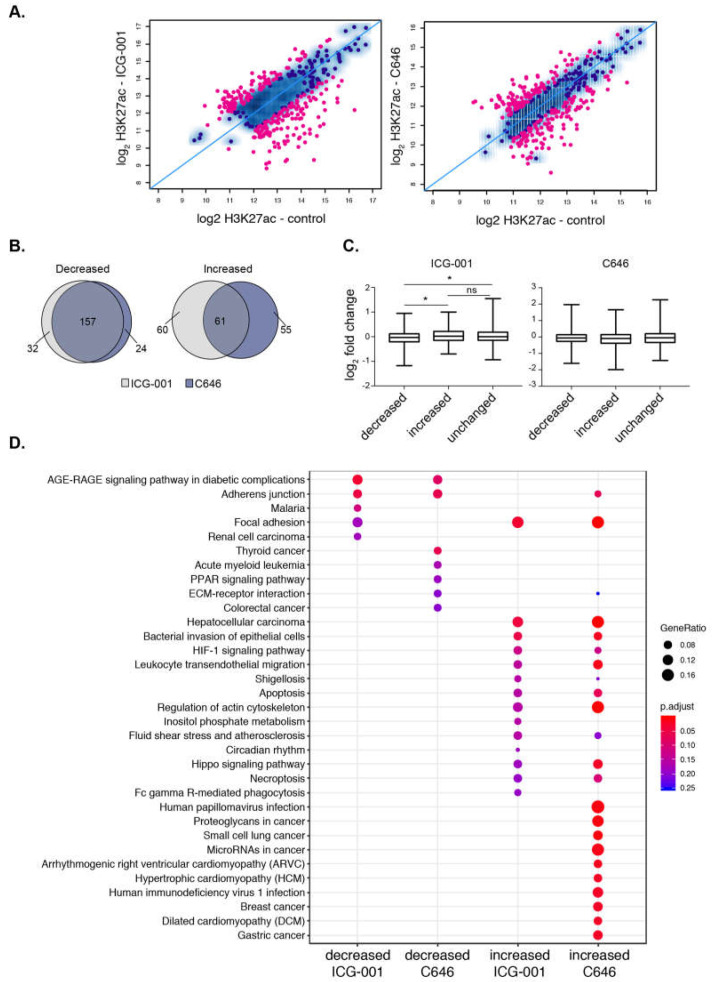
Figure 4.
Histone acetyltransferase (HAT) inhibitors influence the acetylation levels at super-enhancers. (A) Scatterplot displaying the differential enrichment of H3K27ac (log2 ChIP-seq read count) for ICG-001 (left) and C646 (right) compared to control; the blue diagonal line separates those of increasing or decreasing signals with the colored dots corresponding to regions with significant changes in treatment compared to control (FDR < 0.1). (B) Overlap analysis of regions comparing the increased or decreased H3K27ac regions after ICG-001 and C646 treatment. (C) Boxplots displaying log2 fold change of genes (treatment vs. control) within the given differential domains identified in (A) (Welch’s t-test, * represents p < 0.05). (D) Pathway enrichment analysis of genes within altered super-enhancers after ICG-001 or C646 treatment.

