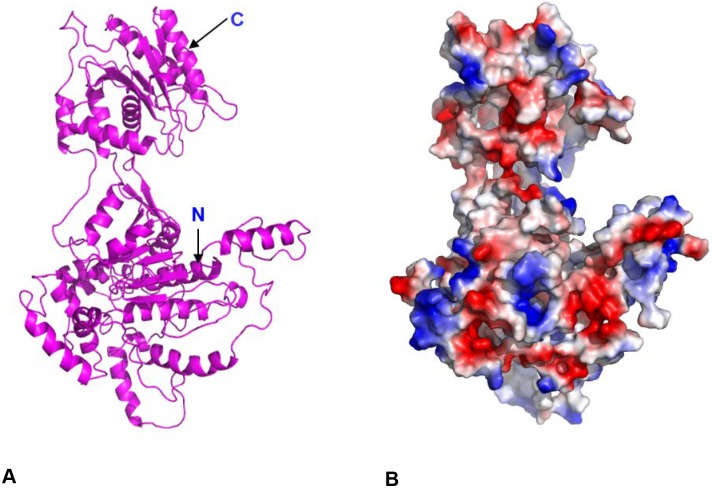
Fig 1. Structural prediction of full-length pUL89.
(A) The ribbon representation of full-length pUL89 model. (B) Surface charge representation of full-length pUL89 is shown. Region of positive, negative and neutral electrostatic potential are indicated in blue, red and white, respectively. Arrows indicate the N and C-terminus.

