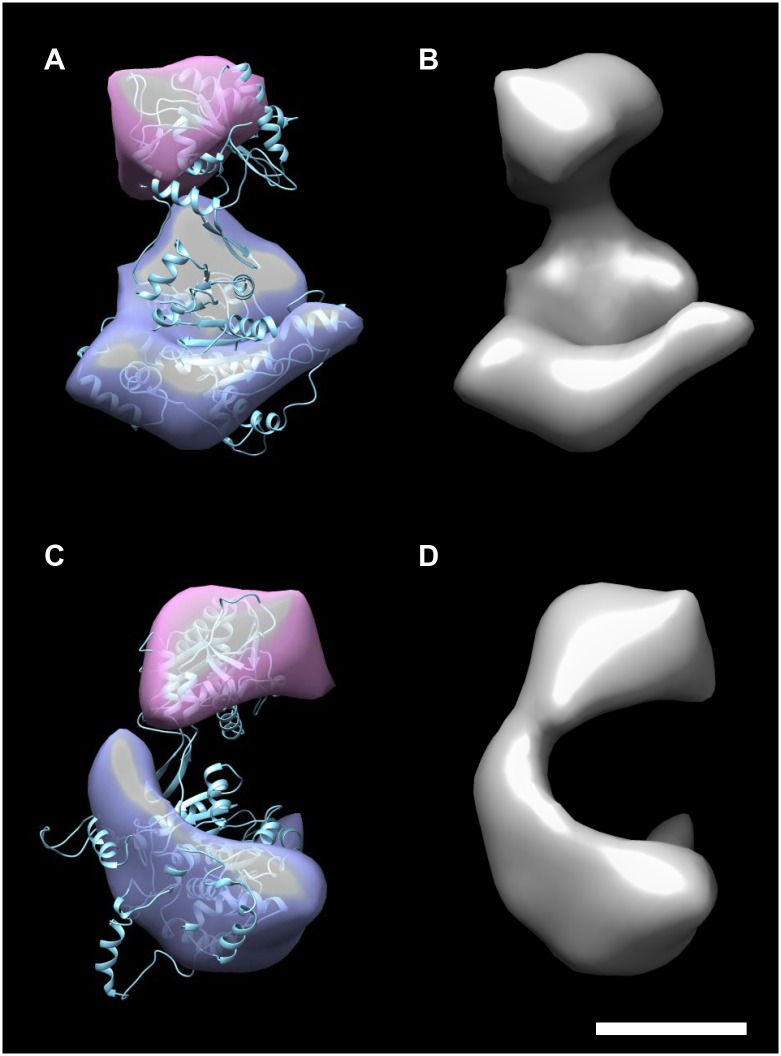
Fig 7. 3-D reconstruction from single particle analysis of rpUL89.
Surface-rendered presentations of the rpUL89 3D reconstruction are shown face-on from the front (A,B), and side-on to the right (C,D) with (A, C) and without (B, D) the predicted structure of pUL89. The scale bar corresponds to 5 nm. The magenta colored segment represents the C-terminal domain and the blue colored the N-terminal domain of pUL89.

