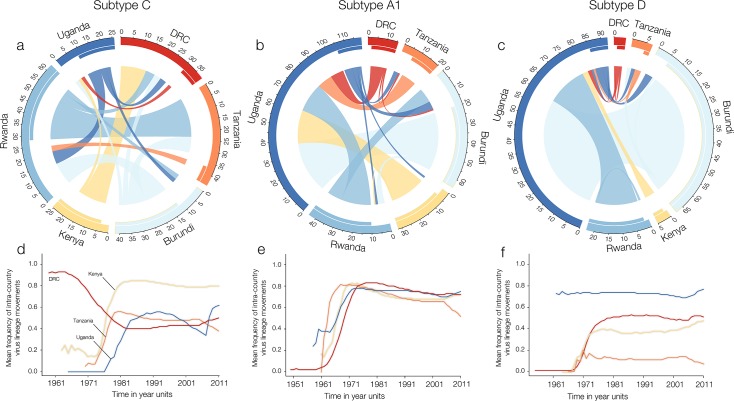
Fig 2. Pathways of HIV-1 lineage movement across Central and East countries.
Fig 2A, 2B and 2C summarise lineage migration estimates for subtypes C-A1-D across Central East Africa and are represented using circular plots. Origin and destination locations of virus lineage movements are connected by circle segments. The width of the link at its basis indicates the frequency of viral movements as estimated using a robust counting approach and can be interpreted using the tick marks on the outside of the circle’s segments. The directionality of the virus lineage movement is encoded by the origin colour and by the gap between link and circle segment at the source location. Fig 2D, 2E and 2F show the estimated proportion of virus lineage movements through time within sampled countries with more than one sampling location. A proportion equal to 1 would indicate that all inferred movements occurred within a single country. This analysis only included virus lineage migration movements between countries for which data were available for at least two locations.

