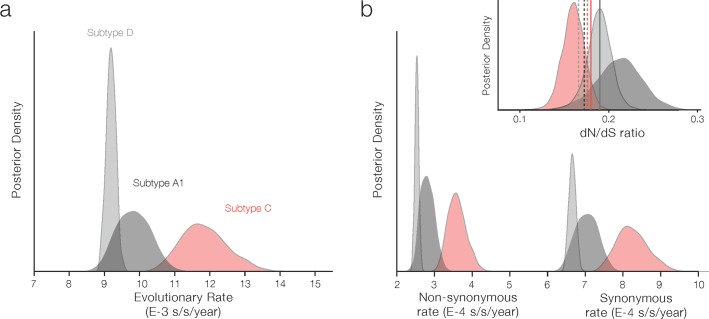
Fig 4. Synonymous and non-synonymous rates of substitution for main subtypes circulating in Central and East Africa.
Panel a shows the posterior distributions for the overall nucleotide substitution rates (substitutions per nucleotide site per year) based on the entire gene region under study. Panel b shows the absolute non-synonymous and the synonymous rates obtained using a renaissance counting approach. Finally, the inset shows the dN/dS ratio obtained using a renaissance counting approach [31], with dashed and solid lines indicating the mean dN/dS ratios estimated with MEME [98] and aBSREL [99]. Please note that the mean dN/dS ratios for subtypes A1 (dark grey solid line) and D (light grey solid line) estimated with aBSREL are overlapping.

