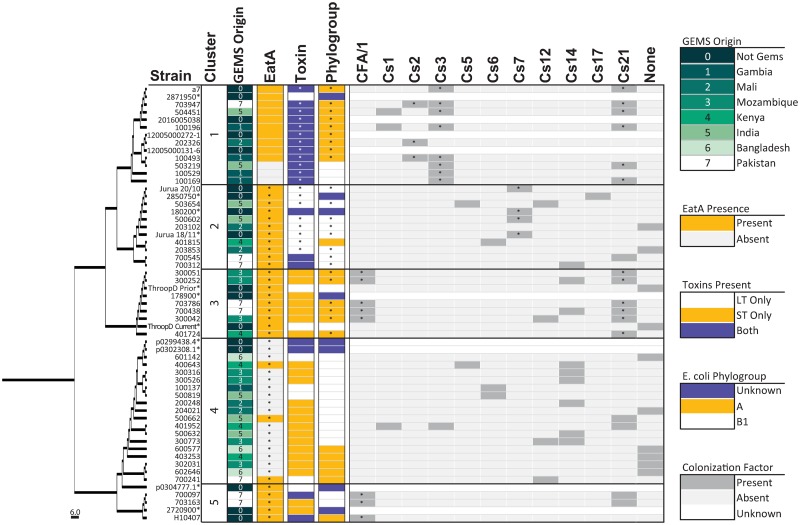
Fig 3. Phylogenetic distribution of EtpA sequences and associated metadata.
Five clusters of EtpA were identified using Clustal Omega and FigTree software. Isolates marked with an asterisk denote sequences downloaded from the NCBI as external references (S3 Table). Within boxes, asterisks represent significant under (e.g., EatA absence in cluster 4) or over representation of the specified variable between clusters as calculated using binomial distributions for each variable. For CFs, “None” designates no CF was identified by PCR. Unknown means we have no data to support the presence or absence of a CF or were not included in the phylogroup analysis. Significant p-values were adjusted for multiple comparisons (* = p < 0.05).

