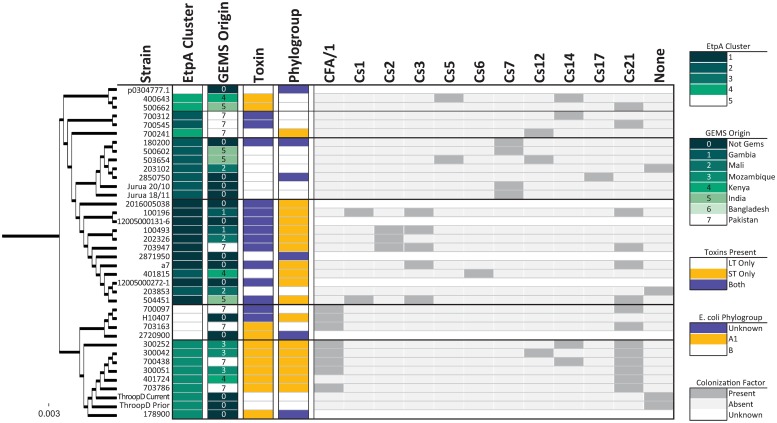
Fig 5. Phylogenetic distribution of EtpA sequences and associated metadata.
Phylogenetic differences between EatA isolates and associated metadata using the same methods as in Fig 1. No statistics were determined for this data set due to small numbers and inherent bias in the data.

