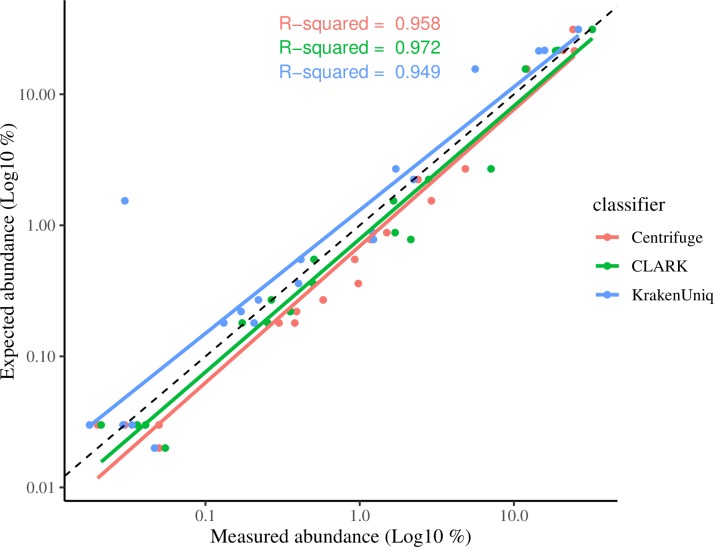
Fig 2. Centrifuge, CLARK, and KrakenUniq abundance estimates versus expected for a staggered abundance mock community.
After quality control, the staggered mock community sequence was analyzed with Centrifuge, CLARK and KrakenUniq using default settings and databases. Abundance results were filtered to include only organisms classified at the species or strain-level with at least 0.1% abundance. The expected abundance of the organisms present in the community was plotted against the abundance reported by each classifier and the R2 calculated. The black dotted line represents perfect correlation with known relative abundances.

