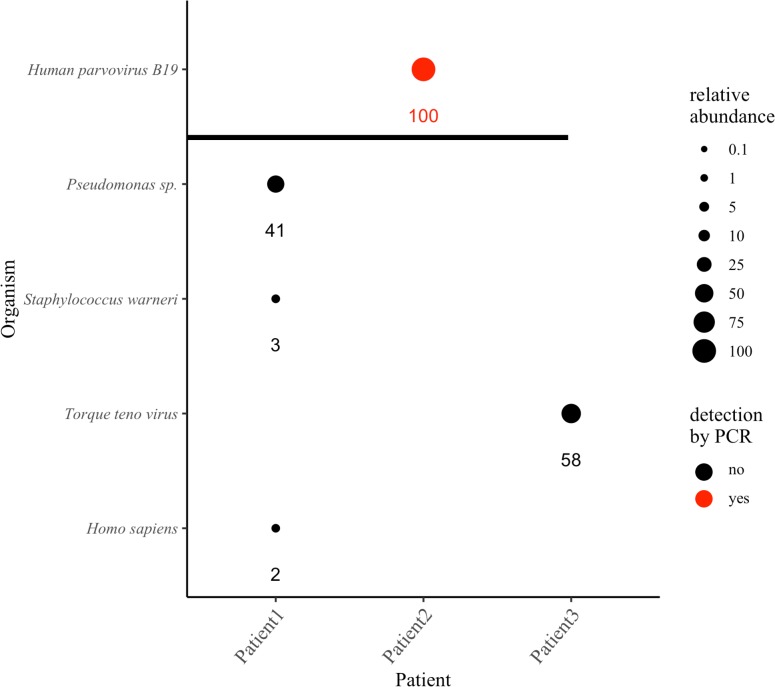
Fig 6. WGS identification and relative abundance of pathogens in febrile neutropenia samples.
Circle size indicates the relative abundance of the respective organism, with the actual values shown below. Human parvovirus detected by a clinical PCR assay are shown in red and graphed above the horizontal black bar. The relative abundances of the multiple strains of Torque teno virus and species of Pseudomonas classified by Centrifuge were summed and reported as Torque teno virus and Pseudomonas sp., respectively.

