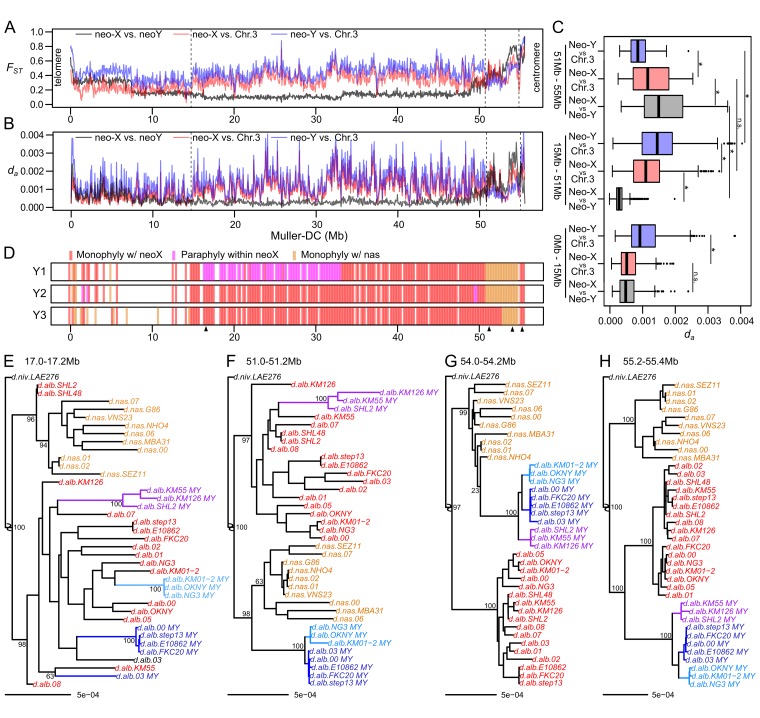
Fig 4. D. nasuta haplotype on the neo-Y.
A. The FST between the neo-sex chromosomes (gray), the neo-X and D. nasuta Chr. 3 (red), and the neo-Y and Chr. 3 (blue) are plotted in the top panel. B. The net divergence (Da) between the neo-sex chromosomes (gray), and of neo-X (red) and neo-Y (blue) versus Chr. 3 are in the lower panel. C. The distribution of Da (from 4B) from 0-15Mb, 15-51Mb and 51-55Mb are shown in boxplots; * represents p-values < 0.005 (Wilcoxon’s rank sum test). D. Based on sliding-window 200kb maximum likelihood trees of neo-Xs, neo-Ys, and Chr. 3s, the phylogenetic relationships between each Y1 group to the neo-X and Chr. 3s are determined. Windows in which the neo-Ys fall within or are sisters to neo-Xs either monophyletically or paraphyletically are plotted in red or magenta, respectively. Windows in which they fall within or are sisters to Chr. 3 are marked yellow. Missing windows are those in which the neo-Xs and Chr. 3s do not sort cleanly into separate clades, likely due to introgression or incomplete lineage sorting. The SHL2 and SHL48 lines are removed from the phylogenies prior to topology inference. E-H Representative windows (demarcated by arrowheads in 4D) of notable topologies are displayed, with the neo-Xs and Chr. 3s colored in red and yellow, respectively; neo-Y individuals are color-coded by their Y group, as in Fig 1. Bootstrap support values are displayed for the species split nodes, the neo-X and neo-Y split nodes, and the neo-Y and Chr. 3 split nodes.

