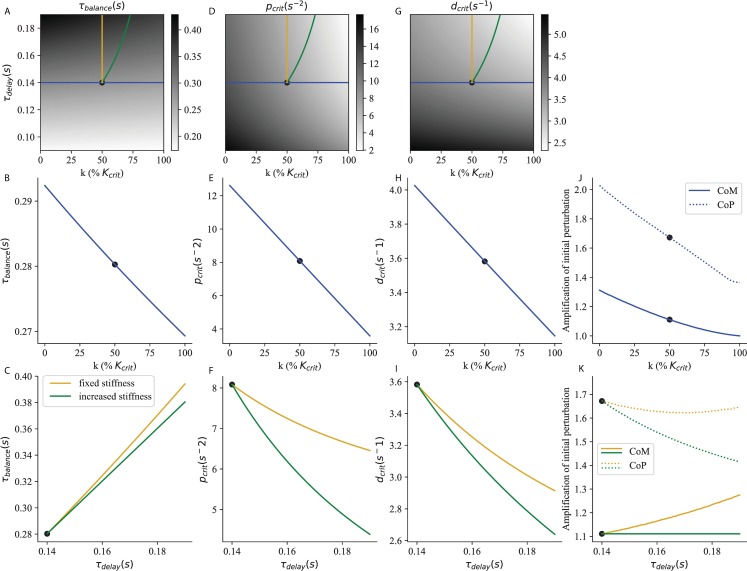
Fig 3. Critical feedback.
The time to recover balance (A, B, C), the corresponding critical proportional (D, E, F) and derivative (G, H, I) gains and the peak excursions (J,K) of the CoM (full line) and CoP (dashed line) are shown as a function of stiffness and neural delay. The strategy of increasing ankle stiffness with constant τdelay = 0.14 s is illustrated in blue. The effect of an increase in neural delay with fixed ankle stiffness k = 50% Kcrit is illustrated in yellow. The strategy of increasing ankle stiffness to compensate for an increased delay (maintaining a constant S) is illustrated in green. The reference system used in section V. is indicated as a black dot.

