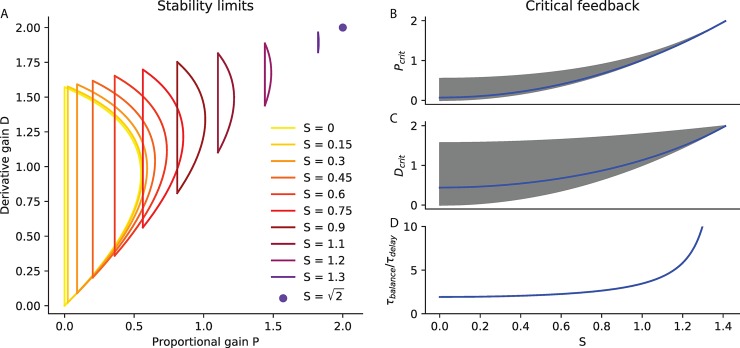
Fig 8. Delayed feedback control.
A. Stability limits. The range of stable normalised proportional and derivative gains (P and D) is plotted for different values of relative speed S ranging from S = 0 to the maximal . B-D Critical feedback. B. The critical proportional gain Pcrit is plotted in blue as a function of S. The range of stable proportional gains is shaded in grey. C. The critical derivative gain Dcrit is plotted in blue as a function of S. The range of stable derivative gains is shaded in grey. D. The time required to recover balance with critical feedback is plotted as a function of S.

