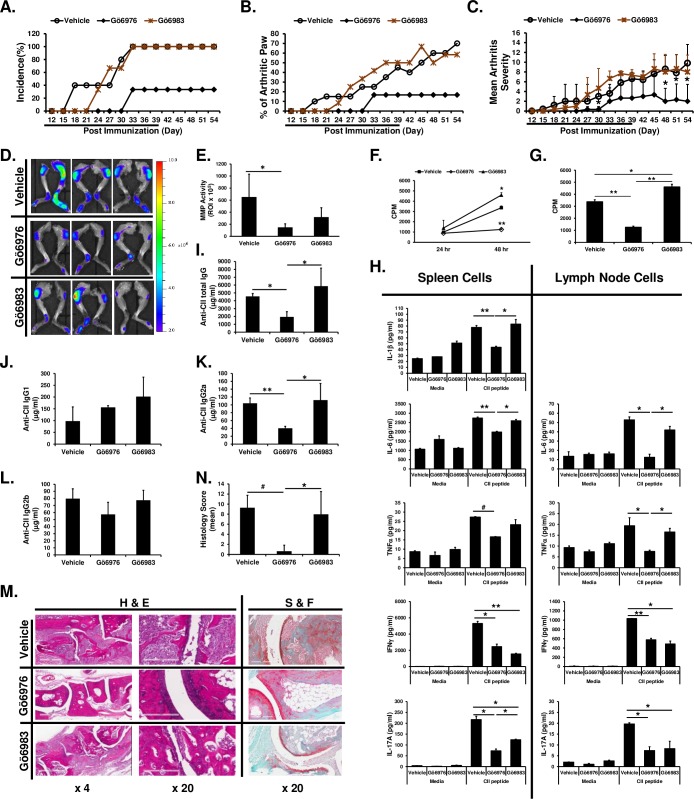
Fig 4. Differential effects of Gö6976 and Gö6983 on CIA.
HLA-DR1 mice were immunized with bovine CII and treated daily with vehicle (n = 5), Gö6976 (n = 3), Gö6983 (n = 3) for 39 days (indicated as underline) starting at the day of CII immunization. Mice were observed daily and development of arthritis was assessed up to 54 days post immunization. (A) Incidence of arthritis. (B) The % of arthritic paws. (C) Mean arthritis severity score. Data represent the mean ± SD. *, p < 0.05. (D—E) At day 54, mice were injected i.v. with MMPSense® 750 FAST Fluorescent Imaging Agent (750F). Twenty four hours later, mice were anesthetized and then scanned using IVIS® Lumina XR System (D). Fluorescence intensities were quantified within ROI by using Living Image 4.0 software (E). Calculations are represented graphically as radiant efficiency (photons/s/cm2/str)/(μW/cm2). Data represent the mean of the group ± SD. *, p < 0.05. (F-N) At day 55, inguinal lymph nodes, spleens, blood, and hind paws were harvested. (F, G) Lymph node cells were incubated in 96-well plate (8 x 10⁵ cells/200 μl/well) for 43 hrs. One μCi of [3H]thymidine was added to each well, and the cells were harvested after an additional 5 hr of culture. Data present the mean (cpm) ± SD. *, p < 0.05; **, p < 0.005. (H) Spleen cells and lymph node cells were stimulated with media or synthetic CII peptide (10 μg/ml) for 24 hr (for IL-6 in spleen cell culture), 48 hr (for IFNγ and IL-17A in both spleen cell and lymph node cell culture), or 72 hr (for IL-1β and TNFα in both spleen cell and lymph node cell culture, and IL-6 on lymph node cell culture). The levels of cytokines in the culture supernatants were analyzed by multiplex sandwich immunoassay. Data represent the mean concentration (pg/ml) ± SD. *, p < 0.05; **. (I–L) Levels of total serum anti-CII IgG antibodies (I), anti-CII IgG1 antibodies (J), anti-CII IgG2a antibodies (K) and anti-CII IgG2b antibodies (L) were analyzed by isotype-specific anti-CII IgG ELISA. Data represent the mean concentration (μg/ml) ± SD. *, p < 0.05; **, p < 0.005. (M) Representative H&E or S&F stained joint tissue sections at day 55 post immunization. White scale bar = 600 μm at 4 x of the original objective. White scale bar = 200 μm at 20 x of the original objective. (N) Histology score (vehicle: n = 10 paws, Gö6976: n = 6 paws, Gö6983: n = 6 paws). Data represent the mean ± SD. *, p < 0.05; #, p < 0.0005.

