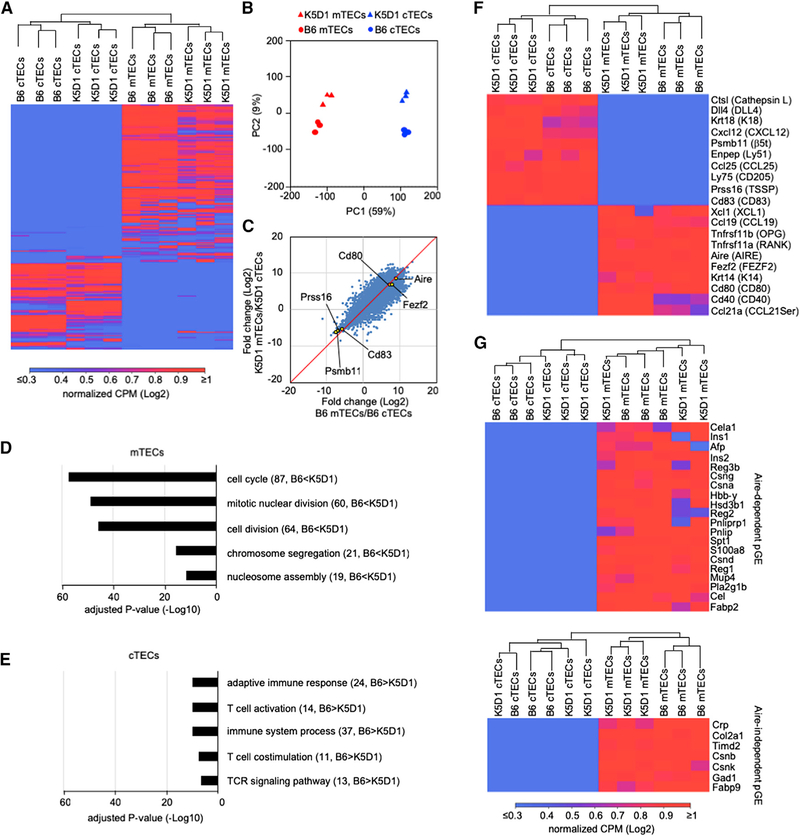
Figure 3. RNA Sequencing Analysis of cTECs and mTECs.
(A) Unsupervised hierarchical cluster analysis and heatmap for detected genes in cTECs and mTECs (n = 3) isolated from B6 mice and K5D1 mice.
(B) Principal component (PC) analysis of RNA sequencing data of indicated cell populations.
(C) Correlation plot analysis of the transcriptome according to log2 fold change (mTECs/cTECs) between B6 and K5D1 TECs.
(D and E) Enrichment analysis of the ontology for genes that are differently expressed (RPKM > 1, log2 fold change > 1 or < 1, Q < 0.05) between B6 and K5D1 TECs. Bars show the adjusted p values of top 5 categories enriched in mTECs (D) and cTECs (E). Numbers in parentheses indicate the number of categorized genes.
(F) Unsupervised hierarchical cluster analysis and heatmap of genes that are associated with the unique functions of cTECs and mTECs.
(G) Unsupervised hierarchical cluster analysis and heatmap of Aire-dependent (top) and Aire-independent (bottom) promiscuously expressed genes. pGE, promiscuous gene expression.

