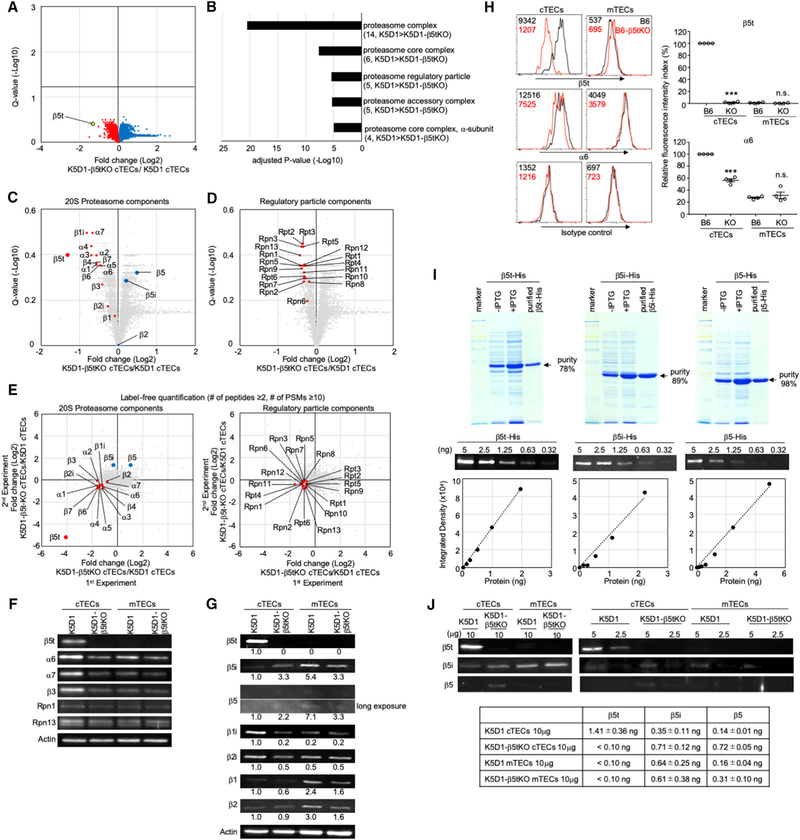
Figure 6. Alteration in Proteasome Components in cTECs in β5t-Deficient Mice.
(A) Volcano plot analysis of proteomes for K5D1-β5tKO cTECs and K5D1 cTECs. Detected proteins are plotted as log2 fold changes (K5D1-β5tKO cTECs/K5D1 cTECs) versus −log10 Q values. Black horizontal line in the plot shows the Q value of 0.05.
(B) Enrichment analysis of the ontology for proteins differently (Q < 0.4) expressed between K5D1 cTECs and K5D1-β5tKO cTECs. Bars show the adjusted p values of top 5 categories. Numbers in parentheses indicate the number of categorized proteins.
(C and D) Volcano plots for 20S proteasome components (C) and regulatory particle proteasome components (D). Plotted are log2 fold changes (K5D1-β5tKO cTECs/K5D1 cTECs) versus −log10 Q values for individual components.
(E) Label-free proteomic analysis of protein abundance of cTECs isolated from K5D1 and K5D1-β5tKO mice. Plotted are log2 fold changes (K5D1-β5tKO cTECs/K5D1 cTECs) of 20S proteasome components (left) and regulatory particle proteasome components (right) in two independent measurements.
(F) Immunoblot analysis of β5t, α6, α7, β3, Rpn1, and Rpn13 proteins in cTECs and mTECs isolated from K5D1 mice and K5D1-β5tKO mice. β-actin was examined as loading control.
(G) Immunoblot analysis of β5t, β5i, β5, β2i, β1i, β2, and β1 proteins in cTECs and mTECs isolated from K5D1 mice and K5D1-β5tKO mice. β-actin was examined as loading control. Numbers show relative amounts of the signals normalized with those of actin.
(H) Histograms show the flow cytometric detection of β5t (top) and α6 (middle) along with the background signals detected by isotype control reagents (bottom) in cTECs and mTECs from B6 mice (black line) and B6-β5tKO mice (red line). Numbers in histograms show the mean fluorescence intensity (MFI). Plots on the right show the relative fluorescence intensity indexes (RFI; means and SEMs, n = 4) of β5t (top) and α6 (bottom) expression. ***p < 0.001; n.s. not significant (comparison between B6 and KO groups).
(I) Coomassie Brilliant Blue stained SDS-PAGE gels showing the production and purification of β5t-His, β5i-His, and β5-His proteins (top). The absolute amounts of purified proteins were determined by a fluorometer and normalized to protein purity. Immunoblot analysis of indicated amounts of β5t-His, β5i-His, and β5-His proteins (middle). Standard curves between the amounts of purified β5t-His, β5i-His, and β5-His proteins on the x axis and the integrated density of the immunoblot signals on the y axis (bottom).
(J) Immunoblot analysis of β5t, β5i, and β5 proteins in indicated amounts (μg) of the lysates of cTECs and mTECs isolated from K5D1 mice and K5D1-β5tKO mice. The amounts of indicated proteins (n = 3) were deduced according to the standard curves shown in (I).

