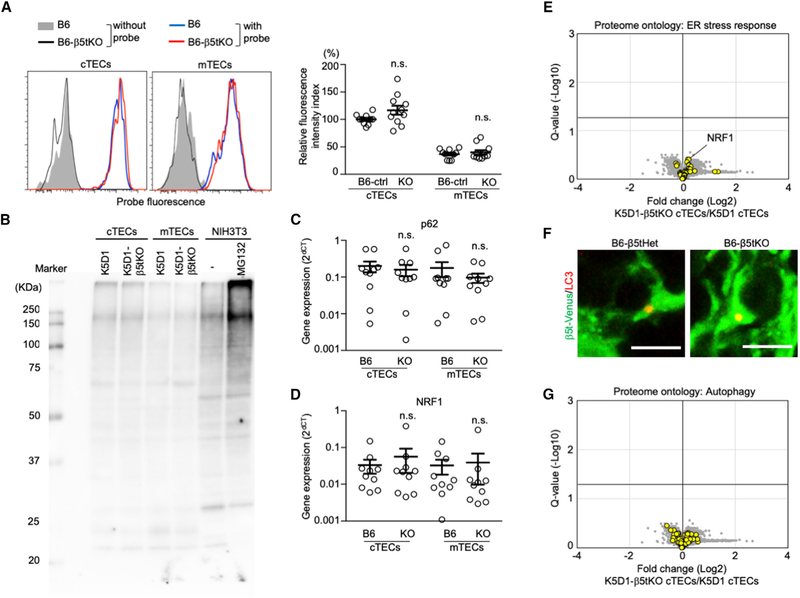
Figure 7. No Constitutive Stress Response in cTECs in β5t-Deficient Mice.
(A) Proteasome activity in β5t-deficient and control cTECs. Histograms show the detection of proteasome activity by cell-permeable triple-leucine substrate-based fluorescent probe in cTECs and mTECs of B6 mice (blue line) and B6-β5tKO mice (red line). Shaded area and black line represent background fluorescence profiles without the addition of proteasome probe in B6 TECs and B6-β5tKO TECs, respectively. Plots on the right show relative fluorescence intensity index (means and SEMs, n = 10–11). B6-ctrl indicates B6 and B6-β5tHet mice. n.s., not significant.
(B) Immunoblot analysis of ubiquitin in cTECs and mTECs isolated from K5D1 and K5D1-β5tKO mice. NIH 3T3 cells with or without proteasome inhibitor MG132 treatment were also examined.
(C and D) qPCR analysis of mRNA expression levels (means and SEMs, n = 10) of p62/Sqstm1 (C) and Nrf1 (D) relative to Gapdh in cTECs and mTECs isolated from B6 and B6-β5tKO mice. n.s., not significant.
(E) Volcano plot analysis of TMT-based quantitative proteomes for K5D1-β5tKO cTECs and K5D1 cTECs, highlighting proteins with the ontology of ER stress response (yellow symbols). Detected proteins are plotted as log2 fold changes (K5D1-β5tKO cTECs/K5D1 cTECs) versus −log10 Q values. Black horizontal line in the plot shows the Q value of 0.05.
(F) Immunofluorescence analysis of LC3 (red) and β5t-venus (green) in the thymic sections of B6-β5tHet (β5tVenus/+) and B6-β5tKO (β5tVenus/Venus) mice. Representative data from two independent experiments are shown. Scale bars, 5 μm.
(G) Volcano plot analysis of TMT-based quantitative proteomes for K5D1-β5tKO cTECs and K5D1 cTECs, highlighting proteins with the ontology of autophagy (yellow symbols). Detected proteins are plotted as log2 fold changes (K5D1-β5tKO cTECs/K5D1 cTECs) versus −log10 Q values. Black horizontal line in the plot shows the Q value of 0.05.

