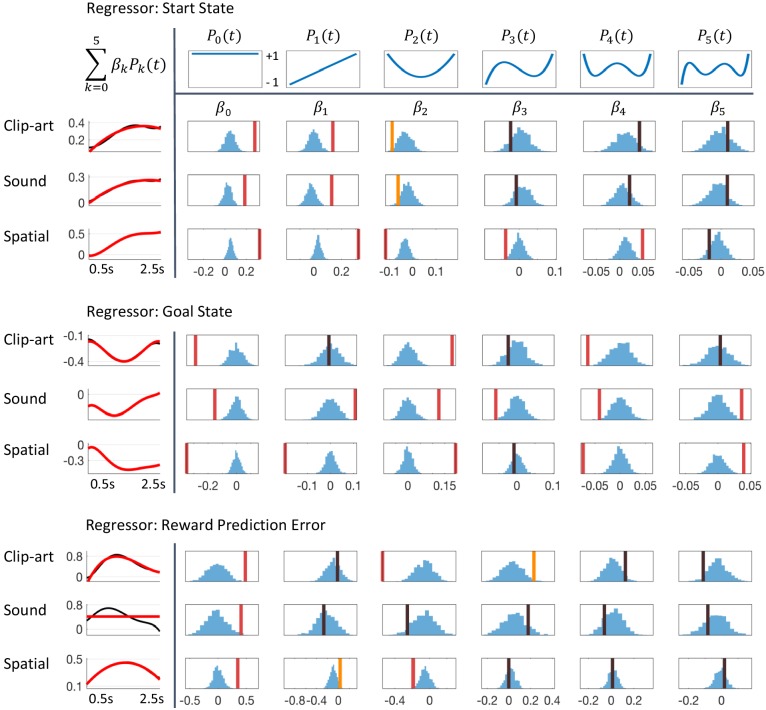
Figure 11. Detailed results of regression analysis and permutation tests.
The regressors are top: Start state event, middle: Goal state event and bottom: Reward Prediction Error. We extracted the time course of the pupil dilation in (500 ms, 2500 ms) after state onset for each of the conditions, clip-art, sound and spatial, using Legendre polynomials of orders k = 0 to k = 5 (top row) as basis functions. The extracted weights (cf. Equation 8) are shown in each column below the corresponding Legendre polynomial as vertical bars with color indicating the level of significance (red, statistically significant at p<0.05/6 (Bonferroni); orange, p<0.05; black, not significant). Blue histograms summarize shuffled samples obtained by 1000 permutations. Black curves in the leftmost column show the fits with all six Legendre Polynomials, while the red curve is obtained by summing only over the few Legendre Polynomials with significant . Note the similarity of the pupil responses across conditions.

