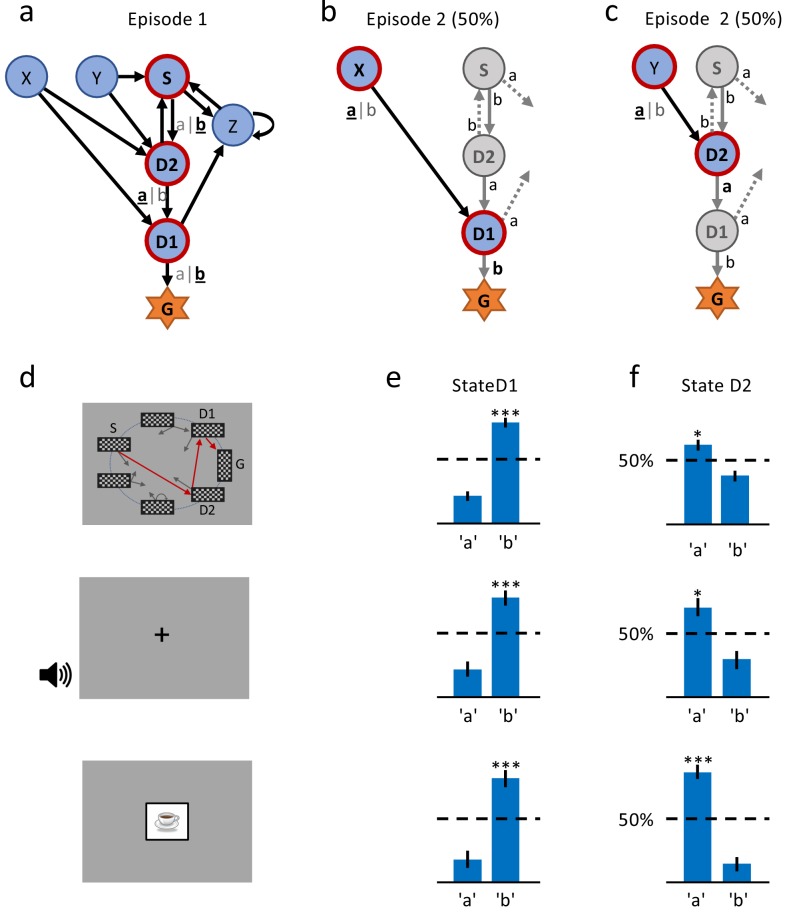
Figure 2. A single delayed reward reinforces state-action associations.
(a) Structure of the environment: six states, two actions, rewarded goal G. Transitions (arrows) were predefined, but actions were attributed to transitions during the experiment. Unbeknownst to the participants, the first actions always led through the sequence S (Start), D2 (two steps before goal), D1 (one step before goal) to G (Goal). Here, the participant chose actions ’b’, ’a’, ’b’ (underlined boldface). (b) Half of the experiments, started episode 2 in X, always leading to D1, where we tested if the action rewarded in episode 1 was repeated. (c) In the other half of experiments, we tested the decision bias in episode 2 at D2 (’a’ in this example) by starting from Y. (d) The same structure was implemented in three conditions. In the spatial condition (22 participants, top row in Figures (d), (e) and (f)), each state is identified by a fixed location (randomized across participants) of a checkerboard, flashed for a 100 ms on the screen. Participants only see one checkerboard at a time; the red arrows and state identifiers S, D2, D1, G are added to the figure to illustrate a first episode. In the sound condition (15 participants, middle row), states are represented by unique short sounds. In the clip-art condition (12 participants, bottom row), a unique image is used for each state. (e) Action selection bias in state D1, in episode 2, averaged across all participants. (f) In all three conditions the action choices at D2 were significantly different from chance level (dashed horizontal line) and biased toward the actions that have led to reward in episode 1. Error bars: SEM, , . For clarity, actions are labeled ’a’ and ’b’ in (e) and (f), consistent with panels (a) - (c), even though actual choices of participants varied.

